

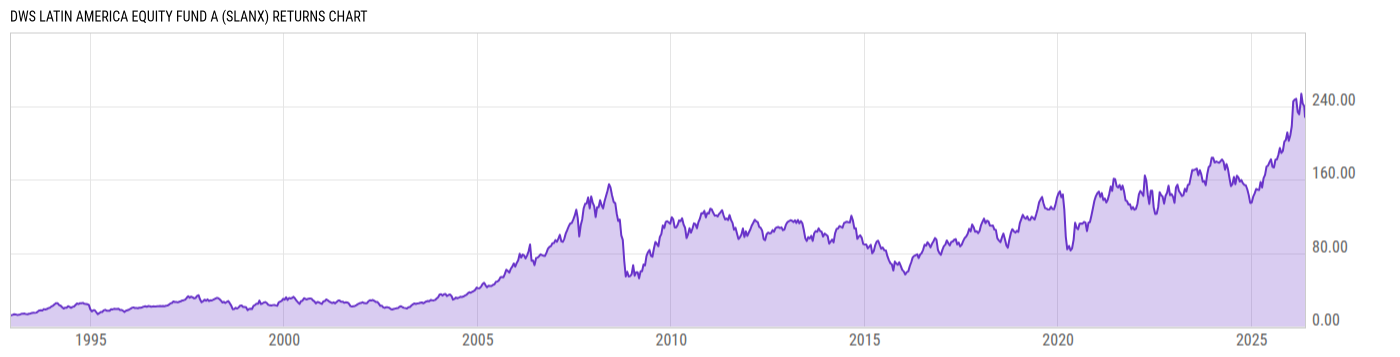
DWS Latin America Equity Fund A (SLANX)
37.68
-0.27
(-0.71%)
USD |
Jun 10 2026
Returns Chart
Key Stats
| Net Expense Ratio | Total Assets Under Management | Weighted Average Dividend Yield | Turnover Ratio (Generic) |
|---|---|---|---|
| 1.39% | 366.25M | 4.77% | 120.0% |
| 1 Year Fund Level Flows | 1 Year Total Returns (Daily) | Annualized Total Returns Since Inception (Daily) | Max Drawdown (Since Inception) |
| 24.25M | 24.11% |
Basic Info
| Investment Strategy | |
| The Fund seeks long-term capital appreciation. The Fund invests at least 80% of net assets in Latin American common stocks and other equities. The Fund defines Latin America as Mexico, Central America, South America and the Spanish-speaking islands of the Caribbean. |
| General | |
| Security Type | Mutual Fund |
| Equity Style | Multi Cap Value |
| Broad Asset Class | International Equity |
| Broad Category | Equity |
| Global Peer Group | Equity Emerging Markets Latin America |
| Peer Group | Latin American Funds |
| Global Macro | Equity Emerging Markets |
| US Macro | Emerging Markets Equity Funds |
| YCharts Categorization | -- |
| YCharts Benchmark | -- |
| Prospectus Objective | Latin American Funds |
| Fund Owner Firm Name | DWS |
| Broad Asset Class Benchmark Index | |
| ^MSACXUSNTR | 100.0% |
Net Fund Flows Versus Peer Group
1 Month
% Rank:
44
-351.14M
Peer Group Low
10.48M
Peer Group High
1 Year
% Rank:
44
24.25M
-516.56M
Peer Group Low
4.072B
Peer Group High
3 Months
% Rank:
35
-511.77M
Peer Group Low
1.428B
Peer Group High
3 Years
% Rank:
89
-158.43M
Peer Group Low
3.424B
Peer Group High
6 Months
% Rank:
44
-253.26M
Peer Group Low
3.058B
Peer Group High
5 Years
% Rank:
75
-125.37M
Peer Group Low
1.798B
Peer Group High
YTD
% Rank:
44
-140.17M
Peer Group Low
2.873B
Peer Group High
10 Years
% Rank:
75
-403.91M
Peer Group Low
4.487B
Peer Group High
Date Unavailable
Risk
Performance Versus Peer Group
Annual Total Returns Versus Peers
As of June 11, 2026.
Asset Allocation
As of March 31, 2026.
| Type | % Net |
|---|---|
| Cash | 0.01% |
| Stock | 83.26% |
| Bond | 0.00% |
| Convertible | 0.00% |
| Preferred | 10.08% |
| Other | 6.66% |
Top 10 Holdings
| Name | % Weight | Price | % Change |
|---|---|---|---|
| Grupo México S.A.B. de C.V. | 5.23% | 11.65 | 1.30% |
| Grupo Financiero Banorte SAB de CV | 4.30% | 10.29 | 5.57% |
| Nu Holdings Ltd. | 3.98% | 12.03 | 3.53% |
| Vale SA | 3.49% | 15.36 | 2.91% |
|
Equatorial SA ORD
|
3.10% | -- | -- |
|
Itau Unibanco Holding SA
|
3.02% | -- | -- |
| Credicorp Ltd. | 2.97% | 368.40 | 4.76% |
| CEMEX SAB de CV | 2.95% | 12.71 | 7.71% |
| Fomento Economico Mexicano SAB de CV | 2.94% | 128.61 | 4.01% |
| Fibra Uno Administración SA de CV | 2.89% | 1.65 | 0.00% |
Fees & Availability
| Fees | |
| Actual 12B-1 Fee | 0.24% |
| Actual Management Fee | 0.75% |
| Administration Fee | 18.66K% |
| Maximum Front Load | 5.75% |
| Maximum Deferred Load | -- |
| Maximum Redemption Fee | 0.00% |
| General Availability | |
| Available for Insurance Product | No |
| Available for RRSP | No |
| Purchase Details | |
| Open to New Investors |
|
| Minimum Initial Investment | 1000.00 None |
| Minimum Subsequent Investment | 50.00 None |
Basic Info
| Investment Strategy | |
| The Fund seeks long-term capital appreciation. The Fund invests at least 80% of net assets in Latin American common stocks and other equities. The Fund defines Latin America as Mexico, Central America, South America and the Spanish-speaking islands of the Caribbean. |
| General | |
| Security Type | Mutual Fund |
| Equity Style | Multi Cap Value |
| Broad Asset Class | International Equity |
| Broad Category | Equity |
| Global Peer Group | Equity Emerging Markets Latin America |
| Peer Group | Latin American Funds |
| Global Macro | Equity Emerging Markets |
| US Macro | Emerging Markets Equity Funds |
| YCharts Categorization | -- |
| YCharts Benchmark | -- |
| Prospectus Objective | Latin American Funds |
| Fund Owner Firm Name | DWS |
| Broad Asset Class Benchmark Index | |
| ^MSACXUSNTR | 100.0% |
Fundamentals
| General | |
| Distribution Yield | -- |
| Dividend Yield TTM (6-10-26) | 3.94% |
| 30-Day SEC Yield | -- |
| 7-Day SEC Yield | -- |
| Number of Holdings | 78 |
| Stock | |
| Weighted Average PE Ratio | 18.43 |
| Weighted Average Price to Sales Ratio | 2.479 |
| Weighted Average Price to Book Ratio | 2.975 |
| Weighted Median ROE | 19.29% |
| Weighted Median ROA | 5.46% |
| ROI (TTM) | 11.58% |
| Return on Investment (TTM) | 11.58% |
| Earning Yield | 0.2187 |
| LT Debt / Shareholders Equity | 0.9107 |
| Number of Equity Holdings | 72 |
As of March 31, 2026
Growth Metrics
| EPS Growth (1Y) | 19.06% |
| EPS Growth (3Y) | 4.42% |
| EPS Growth (5Y) | 23.50% |
| Sales Growth (1Y) | 10.84% |
| Sales Growth (3Y) | 9.48% |
| Sales Growth (5Y) | 17.53% |
| Sales per Share Growth (1Y) | 1.30K% |
| Sales per Share Growth (3Y) | 20.92% |
| Operating Cash Flow - Growth Rate (3Y) | 7.66% |
As of March 31, 2026
Fund Details
Top Portfolio Holders
| Name | % Weight |
|---|---|
| Portfolio A | 5.00% |
| Portfolio B | 3.50% |
| Portfolio C | 2.25% |
Excel Add-In Codes
| Name: =YCI("M:SLANX", "name") |
| Broad Asset Class: =YCI("M:SLANX", "broad_asset_class") |
| Broad Category: =YCI("M:SLANX", "broad_category_group") |
| Prospectus Objective: =YCI("M:SLANX", "prospectus_objective") |
| To find the codes for any of our securities and financial metrics, see our Complete Excel Reference. |