

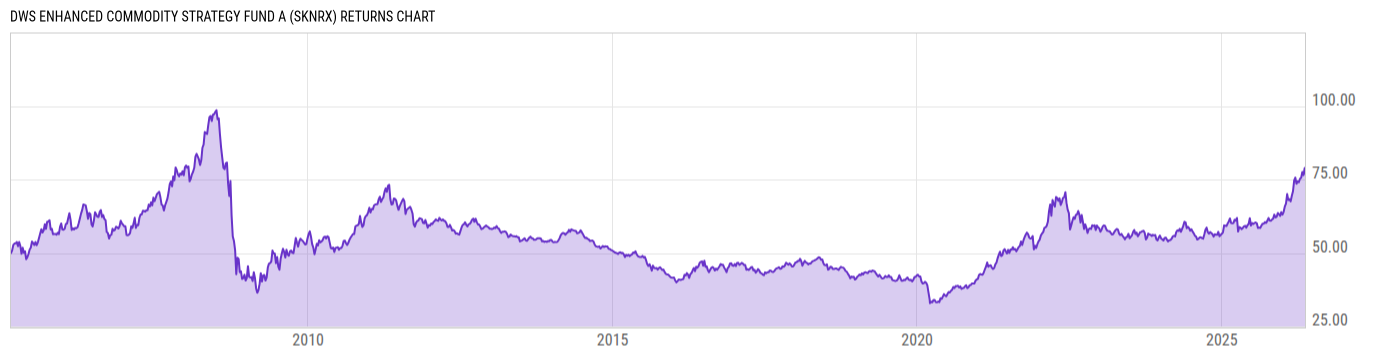
DWS Enhanced Commodity Strategy Fund A (SKNRX)
6.61
-0.08
(-1.20%)
USD |
Jun 09 2026
Returns Chart
Key Stats
| Net Expense Ratio | Total Assets Under Management | Weighted Average Dividend Yield | Turnover Ratio (Generic) |
|---|---|---|---|
| 1.10% | 827.94M | -- | 85.00% |
| 1 Year Fund Level Flows | 1 Year Total Returns (Daily) | Annualized Total Returns Since Inception (Daily) | Max Drawdown (Since Inception) |
| -237.35M | 21.01% |
Basic Info
| Investment Strategy | |
| The Fund seeks total return. The Fund typically invests in commodity-linked derivative instruments backed by a portfolio of fixed income instruments. The Fund invests in commodity-linked derivative instruments such as commodity-linked swaps, structured notes and futures contracts. |
| General | |
| Security Type | Mutual Fund |
| Equity Style | -- |
| Broad Asset Class | Commodities |
| Broad Category | Real Assets |
| Global Peer Group | Commodity Blended |
| Peer Group | Commodities General Funds |
| Global Macro | Commodity Blended |
| US Macro | Commodities Funds |
| YCharts Categorization | -- |
| YCharts Benchmark | -- |
| Prospectus Objective | Commodities Funds |
| Fund Owner Firm Name | DWS |
| Broad Asset Class Benchmark Index | |
| ^BCTR | 100.0% |
Net Fund Flows Versus Peer Group
1 Month
% Rank:
71
-267.38M
Peer Group Low
225.86M
Peer Group High
1 Year
% Rank:
82
-237.35M
-1.413B
Peer Group Low
2.317B
Peer Group High
3 Months
% Rank:
68
-424.27M
Peer Group Low
914.54M
Peer Group High
3 Years
% Rank:
85
-2.785B
Peer Group Low
2.546B
Peer Group High
6 Months
% Rank:
85
-1.287B
Peer Group Low
1.516B
Peer Group High
5 Years
% Rank:
90
-7.491B
Peer Group Low
2.625B
Peer Group High
YTD
% Rank:
87
-460.54M
Peer Group Low
1.296B
Peer Group High
10 Years
% Rank:
90
-4.281B
Peer Group Low
3.873B
Peer Group High
Date Unavailable
Risk
Performance Versus Peer Group
Annual Total Returns Versus Peers
As of June 10, 2026.
Asset Allocation
As of March 31, 2026.
| Type | % Net |
|---|---|
| Cash | 0.00% |
| Stock | 0.00% |
| Bond | 84.70% |
| Convertible | 0.00% |
| Preferred | 0.00% |
| Other | 15.30% |
Top 10 Holdings
| Name | % Weight | Price | % Change |
|---|---|---|---|
|
DWS Government Cash Management Fund
|
14.34% | -- | -- |
| United States of America USGB 01/31/2027 FLT USD Government | 11.20% | 100.01 | 0.00% |
|
United States of America (Government) 0% 18-FEB-2027
|
9.22% | -- | -- |
| United States of America USGB 0.0 09/17/2026 FIX USD Government | 6.38% | 99.01 | 0.01% |
| United States of America USGB 0.0 06/18/2026 FIX USD Government | 4.78% | 99.93 | 0.01% |
| United States of America USGB 4.625 11/15/2026 FIX USD Government | 2.81% | 100.35 | -0.01% |
| United States of America USGB 4.125 09/30/2027 FIX USD Government | 2.81% | 100.08 | 0.02% |
| United States of America USGB 0.625 03/31/2027 FIX USD Government | 2.72% | 97.43 | 0.01% |
|
Other Assets less Liabilities
|
2.34% | -- | -- |
| United States of America USGB 4.375 07/15/2027 FIX USD Government | 2.25% | 100.38 | 0.02% |
Fees & Availability
| Fees | |
| Actual 12B-1 Fee | 0.25% |
| Actual Management Fee | 0.49% |
| Administration Fee | 42.12K% |
| Maximum Front Load | 5.75% |
| Maximum Deferred Load | -- |
| Maximum Redemption Fee | 0.00% |
| General Availability | |
| Available for Insurance Product | -- |
| Available for RRSP | -- |
| Purchase Details | |
| Open to New Investors |
|
| Minimum Initial Investment | 1000.00 None |
| Minimum Subsequent Investment | 50.00 None |
Basic Info
| Investment Strategy | |
| The Fund seeks total return. The Fund typically invests in commodity-linked derivative instruments backed by a portfolio of fixed income instruments. The Fund invests in commodity-linked derivative instruments such as commodity-linked swaps, structured notes and futures contracts. |
| General | |
| Security Type | Mutual Fund |
| Equity Style | -- |
| Broad Asset Class | Commodities |
| Broad Category | Real Assets |
| Global Peer Group | Commodity Blended |
| Peer Group | Commodities General Funds |
| Global Macro | Commodity Blended |
| US Macro | Commodities Funds |
| YCharts Categorization | -- |
| YCharts Benchmark | -- |
| Prospectus Objective | Commodities Funds |
| Fund Owner Firm Name | DWS |
| Broad Asset Class Benchmark Index | |
| ^BCTR | 100.0% |
Fundamentals
| General | |
| Distribution Yield | -- |
| Dividend Yield TTM (6-8-26) | 5.68% |
| 30-Day SEC Yield | -- |
| 7-Day SEC Yield | -- |
| Number of Holdings | 252 |
| Bond | |
| Yield to Maturity (3-31-26) | 4.16% |
| Effective Duration | -- |
| Average Coupon | 4.39% |
| Calculated Average Quality | 2.512 |
| Effective Maturity | 4.172 |
| Nominal Maturity | 4.176 |
| Number of Bond Holdings | 215 |
As of March 31, 2026
Fund Details
Top Portfolio Holders
| Name | % Weight |
|---|---|
| Portfolio A | 5.00% |
| Portfolio B | 3.50% |
| Portfolio C | 2.25% |
Excel Add-In Codes
| Name: =YCI("M:SKNRX", "name") |
| Broad Asset Class: =YCI("M:SKNRX", "broad_asset_class") |
| Broad Category: =YCI("M:SKNRX", "broad_category_group") |
| Prospectus Objective: =YCI("M:SKNRX", "prospectus_objective") |
| To find the codes for any of our securities and financial metrics, see our Complete Excel Reference. |