

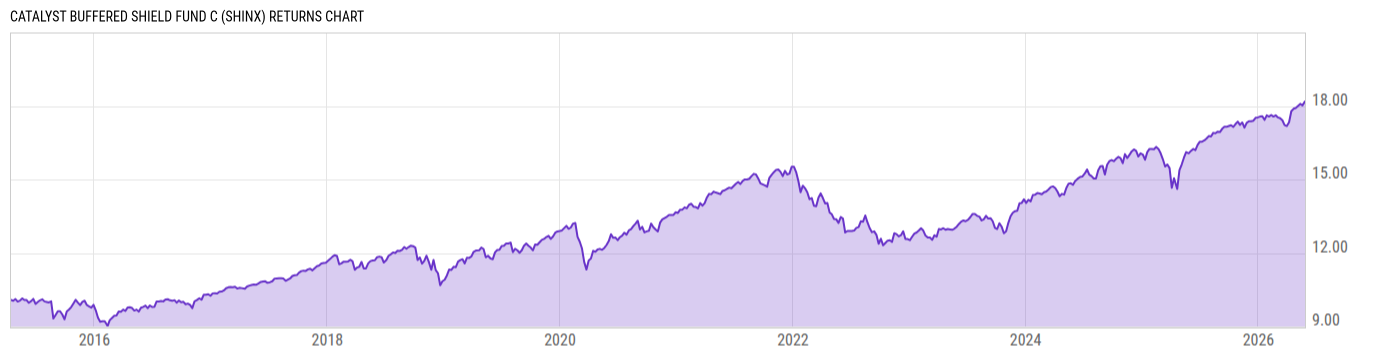
Catalyst Buffered Shield Fund C (SHINX)
10.89
+0.01
(+0.09%)
USD |
May 27 2026
Returns Chart
Key Stats
| Net Expense Ratio | Total Assets Under Management | Weighted Average Dividend Yield | Turnover Ratio (Generic) |
|---|---|---|---|
| 2.35% | 18.86M | -- | 0.10% |
| 1 Year Fund Level Flows | 1 Year Total Returns (Daily) | Annualized Total Returns Since Inception (Daily) | Max Drawdown (Since Inception) |
| -3.210M | 13.17% |
Basic Info
| Investment Strategy | |
| The Fund seeks to track the performance of the NASDAQ Exceed Structured Protection Index. The Index is designed to provide investment returns that are correlated with, but less volatile than, those of the S&P 500 Index and to allow an investment tracking the EXPROT Index to mitigate losses when the S&P 500 declines. |
| General | |
| Security Type | Mutual Fund |
| Equity Style | -- |
| Broad Asset Class | Nontraditional Equity |
| Broad Category | Alternative Strategies |
| Global Peer Group | Alternative Relative Value |
| Peer Group | Options Arbitrage/Opt Strategies Funds |
| Global Macro | Liquid Alternatives |
| US Macro | Equity Income Funds |
| YCharts Categorization | -- |
| YCharts Benchmark | -- |
| Prospectus Objective | Options Arbitrage/Opt Strategies Funds |
| Fund Owner Firm Name | Catalyst Funds |
| Broad Asset Class Benchmark Index | |
| ^SPXTR | 100.0% |
Net Fund Flows Versus Peer Group
1 Month
% Rank:
68
-957.66M
Peer Group Low
696.97M
Peer Group High
1 Year
% Rank:
77
-3.210M
-2.780B
Peer Group Low
8.392B
Peer Group High
3 Months
% Rank:
68
-828.16M
Peer Group Low
2.436B
Peer Group High
3 Years
% Rank:
92
-2.187B
Peer Group Low
25.30B
Peer Group High
6 Months
% Rank:
69
-1.605B
Peer Group Low
4.478B
Peer Group High
5 Years
% Rank:
98
-4.271B
Peer Group Low
33.50B
Peer Group High
YTD
% Rank:
66
-1.195B
Peer Group Low
3.487B
Peer Group High
10 Years
% Rank:
99
-5.755B
Peer Group Low
34.73B
Peer Group High
Date Unavailable
Risk
Performance Versus Peer Group
Annual Total Returns Versus Peers
As of May 28, 2026.
Asset Allocation
As of December 31, 2025.
| Type | % Net |
|---|---|
| Cash | 9.24% |
| Stock | 0.00% |
| Bond | 82.07% |
| Convertible | 0.00% |
| Preferred | 0.00% |
| Other | 8.69% |
Top 10 Holdings
| Name | % Weight | Price | % Change |
|---|---|---|---|
| Vanguard Short-Term Corporate Bond Idx Fd ETF | 34.22% | 79.12 | 0.06% |
| PGIM Ultra Short Bond ETF | 31.22% | 49.72 | 0.01% |
| iShares 1-5 Year Investment Grade Corporate Bd ETF | 23.12% | 52.47 | 0.08% |
|
SPY Mar6 570.0 C
|
4.73% | -- | -- |
|
SPY Sep6 635.0 C
|
3.01% | -- | -- |
|
SPY Jun6 600.0 C
|
2.65% | -- | -- |
|
SPY Jan7 680.0 C
|
2.25% | -- | -- |
|
SPY Jun6 560.0 C
|
2.16% | -- | -- |
|
USD Cash
|
1.89% | -- | -- |
| First American Treasury Obligations Fund X | 1.20% | 1.00 | 0.00% |
Fees & Availability
| Fees | |
| Actual 12B-1 Fee | 1.00% |
| Actual Management Fee | 0.39% |
| Administration Fee | 6.34K% |
| Maximum Front Load | -- |
| Maximum Deferred Load | -- |
| Maximum Redemption Fee | -- |
| General Availability | |
| Available for Insurance Product | No |
| Available for RRSP | No |
| Purchase Details | |
| Open to New Investors |
|
| Minimum Initial Investment | 2500.00 None |
| Minimum Subsequent Investment | 50.00 None |
Basic Info
| Investment Strategy | |
| The Fund seeks to track the performance of the NASDAQ Exceed Structured Protection Index. The Index is designed to provide investment returns that are correlated with, but less volatile than, those of the S&P 500 Index and to allow an investment tracking the EXPROT Index to mitigate losses when the S&P 500 declines. |
| General | |
| Security Type | Mutual Fund |
| Equity Style | -- |
| Broad Asset Class | Nontraditional Equity |
| Broad Category | Alternative Strategies |
| Global Peer Group | Alternative Relative Value |
| Peer Group | Options Arbitrage/Opt Strategies Funds |
| Global Macro | Liquid Alternatives |
| US Macro | Equity Income Funds |
| YCharts Categorization | -- |
| YCharts Benchmark | -- |
| Prospectus Objective | Options Arbitrage/Opt Strategies Funds |
| Fund Owner Firm Name | Catalyst Funds |
| Broad Asset Class Benchmark Index | |
| ^SPXTR | 100.0% |
Fundamentals
| General | |
| Distribution Yield | -- |
| Dividend Yield TTM (5-26-26) | 1.97% |
| 30-Day SEC Yield | -- |
| 7-Day SEC Yield | -- |
| Number of Holdings | 26 |
| Bond | |
| Yield to Maturity (12-31-25) | 4.13% |
| Effective Duration | -- |
| Average Coupon | 4.40% |
| Calculated Average Quality | 2.996 |
| Effective Maturity | 4.444 |
| Nominal Maturity | 4.668 |
| Number of Bond Holdings | 0 |
As of December 31, 2025
Fund Details
Top Portfolio Holders
| Name | % Weight |
|---|---|
| Portfolio A | 5.00% |
| Portfolio B | 3.50% |
| Portfolio C | 2.25% |
Excel Add-In Codes
| Name: =YCI("M:SHINX", "name") |
| Broad Asset Class: =YCI("M:SHINX", "broad_asset_class") |
| Broad Category: =YCI("M:SHINX", "broad_category_group") |
| Prospectus Objective: =YCI("M:SHINX", "prospectus_objective") |
| To find the codes for any of our securities and financial metrics, see our Complete Excel Reference. |