

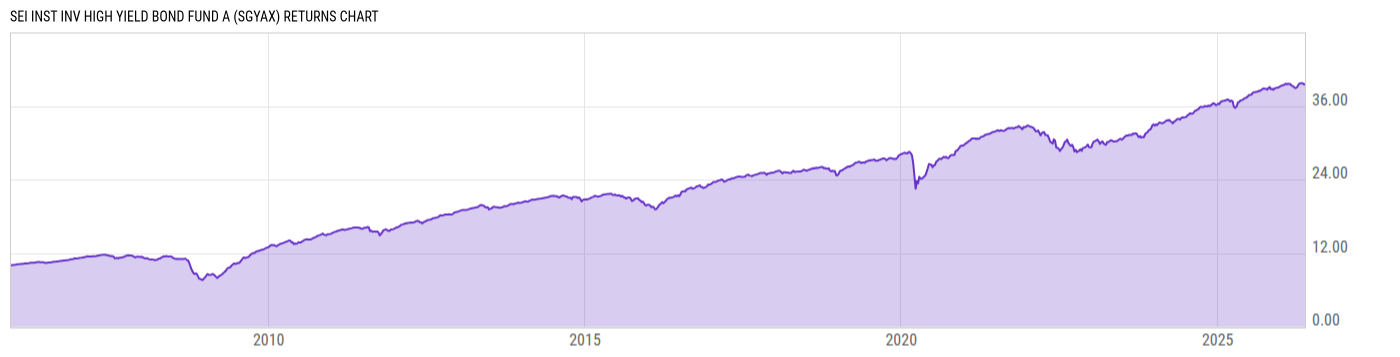
SEI Inst Inv High Yield Bond Fund A (SGYAX)
6.90
0.00 (0.00%)
USD |
Jun 09 2026
Returns Chart
Key Stats
| Net Expense Ratio | Total Assets Under Management | Weighted Average Dividend Yield | Turnover Ratio (Generic) |
|---|---|---|---|
| 0.57% | 2.100B | -- | 53.00% |
| 1 Year Fund Level Flows | 1 Year Total Returns (Daily) | Annualized Total Returns Since Inception (Daily) | Max Drawdown (Since Inception) |
| -21.61M | 6.45% |
Basic Info
| Investment Strategy | |
| The Fund seeks total return by investing in fixed income securities rated below investment grade (junk bonds), including corporate bonds and debentures, convertible and preferred securities, and zero coupon obligations. The Fund's average weighted maturity may vary, and will generally not exceed ten years. |
| General | |
| Security Type | Mutual Fund |
| Equity Style | -- |
| Broad Asset Class | Taxable Bond |
| Broad Category | Fixed Income |
| Global Peer Group | Bond USD High Yield |
| Peer Group | High Yield Funds |
| Global Macro | Bond High Yield |
| US Macro | High Yield Funds |
| YCharts Categorization | -- |
| YCharts Benchmark | -- |
| Prospectus Objective | High Yield Funds |
| Fund Owner Firm Name | SEI |
| Broad Asset Class Benchmark Index | |
| ^BBUSATR | 100.0% |
Net Fund Flows Versus Peer Group
1 Month
% Rank:
17
-2.560B
Peer Group Low
510.03M
Peer Group High
1 Year
% Rank:
54
-21.61M
-2.841B
Peer Group Low
12.05B
Peer Group High
3 Months
% Rank:
61
-2.713B
Peer Group Low
900.82M
Peer Group High
3 Years
% Rank:
79
-4.326B
Peer Group Low
13.55B
Peer Group High
6 Months
% Rank:
59
-2.877B
Peer Group Low
1.301B
Peer Group High
5 Years
% Rank:
83
-9.174B
Peer Group Low
14.79B
Peer Group High
YTD
% Rank:
52
-4.190B
Peer Group Low
1.217B
Peer Group High
10 Years
% Rank:
83
-9.701B
Peer Group Low
21.92B
Peer Group High
Date Unavailable
Risk
Performance Versus Peer Group
Annual Total Returns Versus Peers
As of June 10, 2026.
Asset Allocation
As of April 30, 2026.
| Type | % Net |
|---|---|
| Cash | 1.52% |
| Stock | 2.12% |
| Bond | 96.19% |
| Convertible | 0.00% |
| Preferred | 0.18% |
| Other | -0.01% |
Top 10 Holdings
| Name | % Weight | Price | % Change |
|---|---|---|---|
| SEI Government Fund Institutional | 3.67% | 1.00 | 0.00% |
|
Benefit Street Partners CLO Ltd FRN
|
0.95% | -- | -- |
|
TCP Whitney CLO Ltd FRN
|
0.63% | -- | -- |
| NRG Energy, Inc. XEL-NRGInc 6.25 11/01/2034 FIX USD Corporate 144A | 0.60% | 100.27 | -0.13% |
|
Other Assets less Liabilities
|
0.56% | -- | -- |
| 1261229 B.C. LTD. BCEC 10.0 04/15/2032 FIX USD Corporate 144A | 0.55% | 101.78 | -0.02% |
| Zayo Group Holdings, Inc. ZAYOGR 5.75 03/09/2030 VAR USD Corporate 144A | 0.42% | 99.99 | -0.09% |
| Akumin Inc. AKUMINC 9.75 08/31/2031 FIX USD Corporate 144A | 0.40% | 96.13 | 0.03% |
|
BENEFIT STREET PARTNERS CLO LTD 47 SUB VAR 15-APR-2039
|
0.40% | -- | -- |
| Rithm Capital Corp. RITHCAP 8.0 07/15/2030 FIX USD Corporate 144A | 0.40% | 98.53 | -0.16% |
Fees & Availability
| Fees | |
| Actual 12B-1 Fee | -- |
| Actual Management Fee | 0.49% |
| Administration Fee | -- |
| Maximum Front Load | -- |
| Maximum Deferred Load | -- |
| Maximum Redemption Fee | -- |
| General Availability | |
| Available for Insurance Product | No |
| Available for RRSP | No |
| Purchase Details | |
| Open to New Investors |
|
| Minimum Initial Investment | 100000.0 None |
| Minimum Subsequent Investment | 1000.00 None |
Basic Info
| Investment Strategy | |
| The Fund seeks total return by investing in fixed income securities rated below investment grade (junk bonds), including corporate bonds and debentures, convertible and preferred securities, and zero coupon obligations. The Fund's average weighted maturity may vary, and will generally not exceed ten years. |
| General | |
| Security Type | Mutual Fund |
| Equity Style | -- |
| Broad Asset Class | Taxable Bond |
| Broad Category | Fixed Income |
| Global Peer Group | Bond USD High Yield |
| Peer Group | High Yield Funds |
| Global Macro | Bond High Yield |
| US Macro | High Yield Funds |
| YCharts Categorization | -- |
| YCharts Benchmark | -- |
| Prospectus Objective | High Yield Funds |
| Fund Owner Firm Name | SEI |
| Broad Asset Class Benchmark Index | |
| ^BBUSATR | 100.0% |
Fundamentals
| General | |
| Distribution Yield | -- |
| Dividend Yield TTM (6-8-26) | 8.19% |
| 30-Day SEC Yield (5-31-26) | 7.14% |
| 7-Day SEC Yield | -- |
| Number of Holdings | 1388 |
| Bond | |
| Yield to Maturity (4-30-26) | 6.83% |
| Effective Duration | 2.78 |
| Average Coupon | 6.86% |
| Calculated Average Quality | 5.630 |
| Effective Maturity | 4.654 |
| Nominal Maturity | 5.019 |
| Number of Bond Holdings | 1289 |
As of April 30, 2026
Fund Details
| Key Dates | |
| Inception Date | 12/5/2005 |
| Last Annual Report Date | 5/31/2025 |
| Last Prospectus Date | 9/30/2025 |
| Attributes | |
| Index Fund | -- |
| Inverse Fund | No |
| Leveraged Fund | -- |
| Fund of Funds | No |
| Currency Hedged Fund | -- |
| Socially Responsible Fund | No |
Top Portfolio Holders
| Name | % Weight |
|---|---|
| Portfolio A | 5.00% |
| Portfolio B | 3.50% |
| Portfolio C | 2.25% |
Excel Add-In Codes
| Name: =YCI("M:SGYAX", "name") |
| Broad Asset Class: =YCI("M:SGYAX", "broad_asset_class") |
| Broad Category: =YCI("M:SGYAX", "broad_category_group") |
| Prospectus Objective: =YCI("M:SGYAX", "prospectus_objective") |
| To find the codes for any of our securities and financial metrics, see our Complete Excel Reference. |