

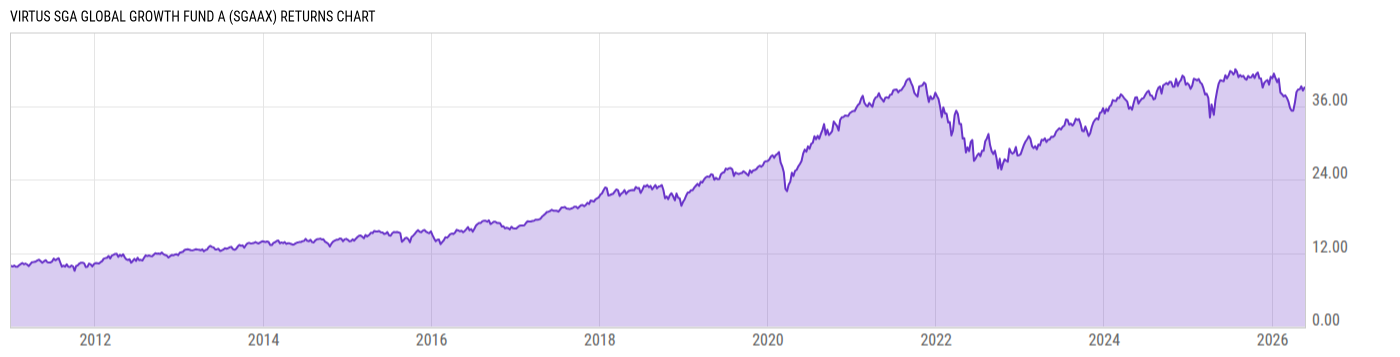
Virtus SGA Global Growth Fund A (SGAAX)
19.70
+0.03
(+0.15%)
USD |
May 22 2026
Returns Chart
Key Stats
| Net Expense Ratio | Total Assets Under Management | Weighted Average Dividend Yield | Turnover Ratio (Generic) |
|---|---|---|---|
| 1.25% | 158.16M | 0.72% | 37.00% |
| 1 Year Fund Level Flows | 1 Year Total Returns (Daily) | Annualized Total Returns Since Inception (Daily) | Max Drawdown (Since Inception) |
| -77.43M | -1.70% |
Basic Info
| Investment Strategy | |
| The Fund seeks long term capital appreciation. The Fund primarily invests in equity securities of companies located throughout the world, including the United States (U.S.), wherein at least 40% of its net assets is invested in issuers organized, headquartered or doing a substantial amount of business outside the U.S. |
| General | |
| Security Type | Mutual Fund |
| Equity Style | Large Cap Growth |
| Broad Asset Class | International Equity |
| Broad Category | Equity |
| Global Peer Group | Equity Global |
| Peer Group | Global Large-Cap Growth |
| Global Macro | Equity Global |
| US Macro | Developed Global Markets Funds |
| YCharts Categorization | -- |
| YCharts Benchmark | -- |
| Prospectus Objective | Global Funds |
| Fund Owner Firm Name | Virtus |
| Broad Asset Class Benchmark Index | |
| ^MSACXUSNTR | 100.0% |
Net Fund Flows Versus Peer Group
1 Month
% Rank:
46
-670.06M
Peer Group Low
159.23M
Peer Group High
1 Year
% Rank:
54
-77.43M
-8.440B
Peer Group Low
5.257B
Peer Group High
3 Months
% Rank:
55
-1.182B
Peer Group Low
758.70M
Peer Group High
3 Years
% Rank:
56
-18.74B
Peer Group Low
5.957B
Peer Group High
6 Months
% Rank:
53
-4.716B
Peer Group Low
5.257B
Peer Group High
5 Years
% Rank:
44
-28.09B
Peer Group Low
7.462B
Peer Group High
YTD
% Rank:
55
-2.197B
Peer Group Low
1.262B
Peer Group High
10 Years
% Rank:
52
-28.76B
Peer Group Low
7.462B
Peer Group High
Date Unavailable
Risk
Performance Versus Peer Group
Annual Total Returns Versus Peers
As of May 24, 2026.
Asset Allocation
As of March 31, 2026.
| Type | % Net |
|---|---|
| Cash | 0.00% |
| Stock | 99.37% |
| Bond | 0.00% |
| Convertible | 0.00% |
| Preferred | 0.00% |
| Other | 0.63% |
Top 10 Holdings
| Name | % Weight | Price | % Change |
|---|---|---|---|
| Taiwan Semiconductor Manufacturing Co., Ltd. | 7.17% | 17.24 | 0.00% |
| NVIDIA Corp. | 6.59% | 215.33 | -1.90% |
| Amazon.com, Inc. | 5.87% | 266.32 | -0.80% |
| Visa, Inc. | 5.74% | 328.88 | -0.68% |
| Alphabet, Inc. | 5.66% | 379.38 | -1.07% |
| Broadcom Inc. | 4.49% | 414.14 | -0.10% |
| Microsoft Corp. | 3.74% | 418.57 | -0.12% |
| Meta Platforms, Inc. | 3.41% | 610.26 | 0.47% |
| Synopsys, Inc. | 3.32% | 524.74 | 4.12% |
| Netflix, Inc. | 3.13% | 88.60 | -0.78% |
Fees & Availability
| Fees | |
| Actual 12B-1 Fee | 0.25% |
| Actual Management Fee | 0.69% |
| Administration Fee | 116.2K% |
| Maximum Front Load | 5.50% |
| Maximum Deferred Load | -- |
| Maximum Redemption Fee | -- |
| General Availability | |
| Available for Insurance Product | No |
| Available for RRSP | No |
| Purchase Details | |
| Open to New Investors |
|
| Minimum Initial Investment | 2500.00 None |
| Minimum Subsequent Investment | 100.00 None |
Basic Info
| Investment Strategy | |
| The Fund seeks long term capital appreciation. The Fund primarily invests in equity securities of companies located throughout the world, including the United States (U.S.), wherein at least 40% of its net assets is invested in issuers organized, headquartered or doing a substantial amount of business outside the U.S. |
| General | |
| Security Type | Mutual Fund |
| Equity Style | Large Cap Growth |
| Broad Asset Class | International Equity |
| Broad Category | Equity |
| Global Peer Group | Equity Global |
| Peer Group | Global Large-Cap Growth |
| Global Macro | Equity Global |
| US Macro | Developed Global Markets Funds |
| YCharts Categorization | -- |
| YCharts Benchmark | -- |
| Prospectus Objective | Global Funds |
| Fund Owner Firm Name | Virtus |
| Broad Asset Class Benchmark Index | |
| ^MSACXUSNTR | 100.0% |
Fundamentals
| General | |
| Distribution Yield | -- |
| Dividend Yield TTM (5-21-26) | 0.08% |
| 30-Day SEC Yield | -- |
| 7-Day SEC Yield | -- |
| Number of Holdings | 10 |
| Stock | |
| Weighted Average PE Ratio | 31.23 |
| Weighted Average Price to Sales Ratio | 8.837 |
| Weighted Average Price to Book Ratio | 8.753 |
| Weighted Median ROE | 31.78% |
| Weighted Median ROA | 16.60% |
| ROI (TTM) | 22.53% |
| Return on Investment (TTM) | 22.53% |
| Earning Yield | 0.0353 |
| LT Debt / Shareholders Equity | 0.4708 |
| Number of Equity Holdings | 10 |
As of March 31, 2026
Growth Metrics
| EPS Growth (1Y) | 31.32% |
| EPS Growth (3Y) | 30.25% |
| EPS Growth (5Y) | 25.74% |
| Sales Growth (1Y) | 18.66% |
| Sales Growth (3Y) | 18.93% |
| Sales Growth (5Y) | 18.00% |
| Sales per Share Growth (1Y) | 19.03% |
| Sales per Share Growth (3Y) | 19.05% |
| Operating Cash Flow - Growth Rate (3Y) | 26.28% |
As of March 31, 2026
Fund Details
Top Portfolio Holders
| Name | % Weight |
|---|---|
| Portfolio A | 5.00% |
| Portfolio B | 3.50% |
| Portfolio C | 2.25% |
Excel Add-In Codes
| Name: =YCI("M:SGAAX", "name") |
| Broad Asset Class: =YCI("M:SGAAX", "broad_asset_class") |
| Broad Category: =YCI("M:SGAAX", "broad_category_group") |
| Prospectus Objective: =YCI("M:SGAAX", "prospectus_objective") |
| To find the codes for any of our securities and financial metrics, see our Complete Excel Reference. |