

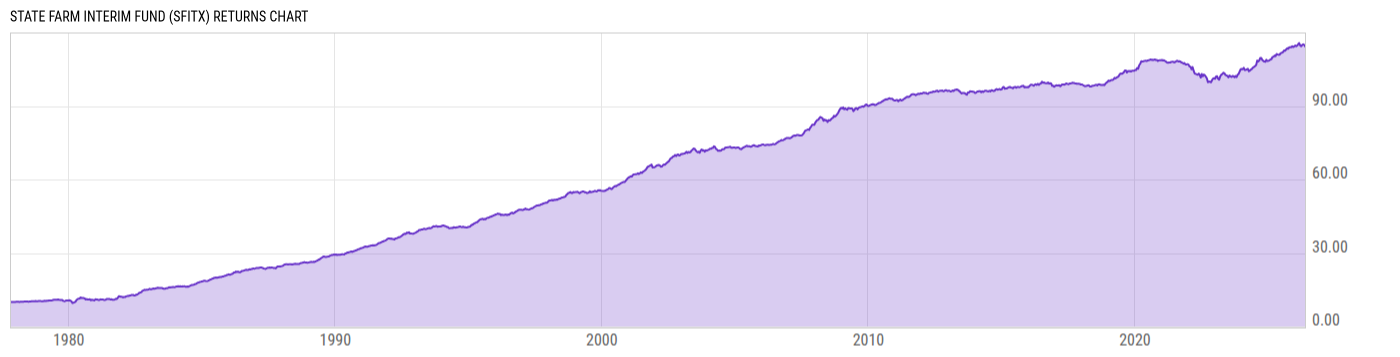
State Farm Interim Fund (SFITX)
9.60
+0.01
(+0.10%)
USD |
Jun 09 2026
Returns Chart
Key Stats
| Net Expense Ratio | Total Assets Under Management | Weighted Average Dividend Yield | Turnover Ratio (Generic) |
|---|---|---|---|
| 0.16% | 288.03M | -- | 50.00% |
| 1 Year Fund Level Flows | 1 Year Total Returns (Daily) | Annualized Total Returns Since Inception (Daily) | Max Drawdown (Since Inception) |
| -22.87M | 3.28% |
Basic Info
| Investment Strategy | |
| The Fund seeks to provide investment results approximating the performance of the Bloomberg 1-5 Year U.S. Treasury Index. Under normal circumstances, the Fund will invest substantially all its net assets in a representative sample of the U.S. Treasury obligations included in the Bloomberg 1-5 Year U.S. Treasury Index. |
| General | |
| Security Type | Mutual Fund |
| Equity Style | -- |
| Broad Asset Class | Taxable Bond |
| Broad Category | Fixed Income |
| Global Peer Group | Bond USD Government Short Term |
| Peer Group | Short U.S. Treasury Funds |
| Global Macro | Bond Short Term |
| US Macro | Short-/Intermediate-Term U.S. Government & Treasury Funds |
| YCharts Categorization | -- |
| YCharts Benchmark | -- |
| Prospectus Objective | Short U.S. Treasury Funds |
| Fund Owner Firm Name | State Farm |
| Broad Asset Class Benchmark Index | |
| ^BBUSATR | 100.0% |
Net Fund Flows Versus Peer Group
1 Month
% Rank:
47
-548.89M
Peer Group Low
6.483B
Peer Group High
1 Year
% Rank:
81
-22.87M
-2.324B
Peer Group Low
42.17B
Peer Group High
3 Months
% Rank:
86
-35.25M
Peer Group Low
16.12B
Peer Group High
3 Years
% Rank:
79
-5.795B
Peer Group Low
76.88B
Peer Group High
6 Months
% Rank:
79
-363.43M
Peer Group Low
25.85B
Peer Group High
5 Years
% Rank:
93
-2.355B
Peer Group Low
86.10B
Peer Group High
YTD
% Rank:
88
-94.00M
Peer Group Low
22.18B
Peer Group High
10 Years
% Rank:
93
-3.070B
Peer Group Low
86.86B
Peer Group High
Date Unavailable
Risk
Performance Versus Peer Group
Annual Total Returns Versus Peers
As of June 10, 2026.
Asset Allocation
As of March 31, 2026.
| Type | % Net |
|---|---|
| Cash | 0.50% |
| Stock | 0.00% |
| Bond | 99.50% |
| Convertible | 0.00% |
| Preferred | 0.00% |
| Other | 0.00% |
Top 10 Holdings
| Name | % Weight | Price | % Change |
|---|---|---|---|
| United States of America USGB 4.0 02/28/2030 FIX USD Government | 1.95% | 99.24 | 0.12% |
| United States of America USGB 4.0 03/31/2030 FIX USD Government | 1.62% | 99.22 | 0.12% |
| United States of America USGB 3.875 04/30/2030 FIX USD Government | 1.57% | 98.75 | 0.14% |
| United States of America USGB 4.125 10/31/2029 FIX USD Government | 1.54% | 99.73 | 0.12% |
| United States of America USGB 4.5 05/31/2029 FIX USD Government | 1.53% | 100.86 | 0.10% |
| United States of America USGB 0.625 05/15/2030 FIX USD Government | 1.50% | 87.07 | 0.15% |
| United States of America USGB 3.5 10/31/2027 FIX USD Government | 1.44% | 99.21 | 0.04% |
| United States of America USGB 3.5 09/30/2029 FIX USD Government | 1.41% | 97.84 | 0.12% |
| United States of America USGB 3.625 08/31/2029 FIX USD Government | 1.40% | 98.27 | 0.11% |
| United States of America USGB 4.0 05/31/2030 FIX USD Government | 1.39% | 99.16 | 0.13% |
Fees & Availability
| Fees | |
| Actual 12B-1 Fee | -- |
| Actual Management Fee | 0.03% |
| Administration Fee | 264.2K% |
| Maximum Front Load | -- |
| Maximum Deferred Load | -- |
| Maximum Redemption Fee | -- |
| General Availability | |
| Available for Insurance Product | No |
| Available for RRSP | No |
| Purchase Details | |
| Open to New Investors |
|
| Minimum Initial Investment | 250.00 None |
| Minimum Subsequent Investment | 50.00 None |
Basic Info
| Investment Strategy | |
| The Fund seeks to provide investment results approximating the performance of the Bloomberg 1-5 Year U.S. Treasury Index. Under normal circumstances, the Fund will invest substantially all its net assets in a representative sample of the U.S. Treasury obligations included in the Bloomberg 1-5 Year U.S. Treasury Index. |
| General | |
| Security Type | Mutual Fund |
| Equity Style | -- |
| Broad Asset Class | Taxable Bond |
| Broad Category | Fixed Income |
| Global Peer Group | Bond USD Government Short Term |
| Peer Group | Short U.S. Treasury Funds |
| Global Macro | Bond Short Term |
| US Macro | Short-/Intermediate-Term U.S. Government & Treasury Funds |
| YCharts Categorization | -- |
| YCharts Benchmark | -- |
| Prospectus Objective | Short U.S. Treasury Funds |
| Fund Owner Firm Name | State Farm |
| Broad Asset Class Benchmark Index | |
| ^BBUSATR | 100.0% |
Fundamentals
| General | |
| Distribution Yield | -- |
| Dividend Yield TTM (6-8-26) | 3.69% |
| 30-Day SEC Yield (4-30-26) | 3.72% |
| 7-Day SEC Yield | -- |
| Number of Holdings | 133 |
| Bond | |
| Yield to Maturity (3-31-26) | 3.85% |
| Effective Duration | -- |
| Average Coupon | 3.36% |
| Calculated Average Quality | 2.00 |
| Effective Maturity | 2.718 |
| Nominal Maturity | 2.718 |
| Number of Bond Holdings | 130 |
As of March 31, 2026
Fund Details
| Key Dates | |
| Inception Date | 11/1/1977 |
| Last Annual Report Date | 9/30/2025 |
| Last Prospectus Date | 1/28/2026 |
| Attributes | |
| Index Fund | -- |
| Inverse Fund | No |
| Leveraged Fund | -- |
| Fund of Funds | No |
| Currency Hedged Fund | -- |
| Socially Responsible Fund | No |
Top Portfolio Holders
| Name | % Weight |
|---|---|
| Portfolio A | 5.00% |
| Portfolio B | 3.50% |
| Portfolio C | 2.25% |
Excel Add-In Codes
| Name: =YCI("M:SFITX", "name") |
| Broad Asset Class: =YCI("M:SFITX", "broad_asset_class") |
| Broad Category: =YCI("M:SFITX", "broad_category_group") |
| Prospectus Objective: =YCI("M:SFITX", "prospectus_objective") |
| To find the codes for any of our securities and financial metrics, see our Complete Excel Reference. |