

Empower SecureFoundation Balanced ETF Fund A (SFBPX)
12.31
+0.02
(+0.16%)
USD |
Jun 09 2026
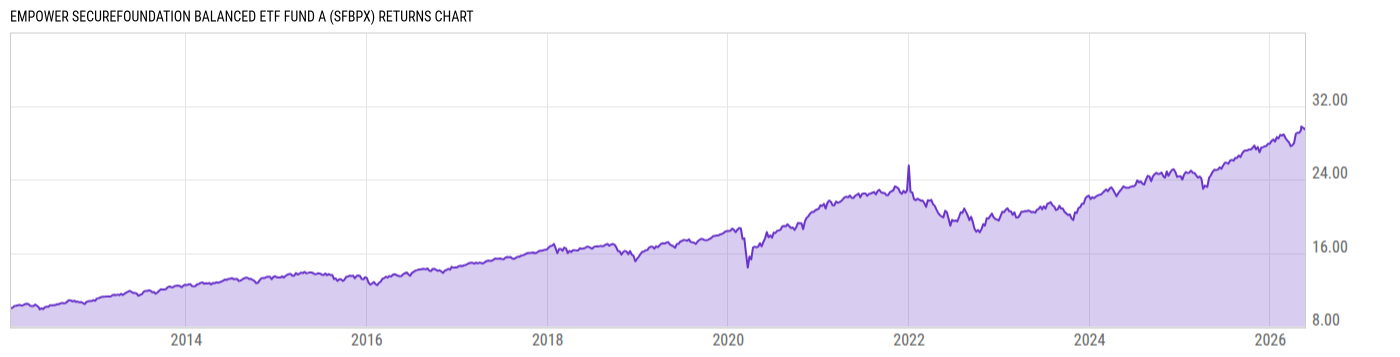
Returns Chart
Key Stats
| Net Expense Ratio | Total Assets Under Management | Weighted Average Dividend Yield | Turnover Ratio (Generic) |
|---|---|---|---|
| 0.27% | 17.24M | -- | 11.00% |
| 1 Year Fund Level Flows | 1 Year Total Returns (Daily) | Annualized Total Returns Since Inception (Daily) | Max Drawdown (Since Inception) |
| -4.839M | 17.33% |
Basic Info
| Investment Strategy | |
| The Fund seeks long-term capital appreciation and income. The Fund will invest 50-70% of its net assets in Underlying ETFs that invest primarily in equity securities and 30-50% of its net assets in Underlying ETFs that invest primarily in fixed income securities. |
| General | |
| Security Type | Mutual Fund |
| Equity Style | -- |
| Broad Asset Class | Allocation |
| Broad Category | Allocation |
| Global Peer Group | Mixed Asset USD Balanced - Global |
| Peer Group | Mixed-Asset Target Alloc Moderate Funds |
| Global Macro | Mixed Asset HC Balanced |
| US Macro | Mixed-Assets Target Allocation Funds |
| YCharts Categorization | -- |
| YCharts Benchmark | -- |
| Prospectus Objective | Balanced Funds |
| Fund Owner Firm Name | Empower |
| Broad Asset Class Benchmark Index | |
| ^SPXTR | 100.0% |
Net Fund Flows Versus Peer Group
1 Month
% Rank:
15
-365.62M
Peer Group Low
32.29M
Peer Group High
1 Year
% Rank:
24
-4.839M
-5.510B
Peer Group Low
642.22M
Peer Group High
3 Months
% Rank:
20
-1.193B
Peer Group Low
97.62M
Peer Group High
3 Years
% Rank:
15
-21.36B
Peer Group Low
3.106B
Peer Group High
6 Months
% Rank:
23
-3.729B
Peer Group Low
576.03M
Peer Group High
5 Years
% Rank:
19
-30.46B
Peer Group Low
2.725B
Peer Group High
YTD
% Rank:
22
-1.851B
Peer Group Low
585.46M
Peer Group High
10 Years
% Rank:
27
-51.73B
Peer Group Low
3.718B
Peer Group High
Date Unavailable
Risk
Performance Versus Peer Group
Annual Total Returns Versus Peers
As of June 10, 2026.
Asset Allocation
As of December 31, 2025.
| Type | % Net |
|---|---|
| Cash | 1.44% |
| Stock | 57.81% |
| Bond | 39.29% |
| Convertible | 0.00% |
| Preferred | 0.11% |
| Other | 1.36% |
Top 8 Holdings
| Name | % Weight | Price | % Change |
|---|---|---|---|
| Vanguard Total Bond Market Index Fund ETF | 39.16% | 72.90 | -0.09% |
| Vanguard 500 Index Fund ETF | 20.35% | 667.05 | -1.57% |
| Vanguard Developed Markets Index Fund ETF | 13.70% | 68.80 | -1.48% |
| Vanguard S&P Mid-Cap 400 Index Fund ETF | 11.26% | 124.63 | -1.37% |
| Vanguard Russell 2000 Index Fund ETF | 8.75% | 113.97 | -1.03% |
| Vanguard Emerging Markets Stock Index Fund ETF | 4.52% | 57.71 | -1.27% |
| Federated Hermes Government Obligations Fd Inst | 2.28% | 1.00 | 0.00% |
|
Other Assets less Liabilities
|
-0.02% | -- | -- |
Fees & Availability
| Fees | |
| Actual 12B-1 Fee | -- |
| Actual Management Fee | -- |
| Administration Fee | -- |
| Maximum Front Load | 0.00% |
| Maximum Deferred Load | -- |
| Maximum Redemption Fee | -- |
| General Availability | |
| Available for Insurance Product | No |
| Available for RRSP | No |
| Purchase Details | |
| Open to New Investors | No |
| Minimum Initial Investment | 10000.00 None |
| Minimum Subsequent Investment | 500.00 None |
Basic Info
| Investment Strategy | |
| The Fund seeks long-term capital appreciation and income. The Fund will invest 50-70% of its net assets in Underlying ETFs that invest primarily in equity securities and 30-50% of its net assets in Underlying ETFs that invest primarily in fixed income securities. |
| General | |
| Security Type | Mutual Fund |
| Equity Style | -- |
| Broad Asset Class | Allocation |
| Broad Category | Allocation |
| Global Peer Group | Mixed Asset USD Balanced - Global |
| Peer Group | Mixed-Asset Target Alloc Moderate Funds |
| Global Macro | Mixed Asset HC Balanced |
| US Macro | Mixed-Assets Target Allocation Funds |
| YCharts Categorization | -- |
| YCharts Benchmark | -- |
| Prospectus Objective | Balanced Funds |
| Fund Owner Firm Name | Empower |
| Broad Asset Class Benchmark Index | |
| ^SPXTR | 100.0% |
Fundamentals
| General | |
| Distribution Yield | -- |
| Dividend Yield TTM (6-8-26) | 2.75% |
| 30-Day SEC Yield | -- |
| 7-Day SEC Yield | -- |
| Number of Holdings | 8 |
| Stock | |
| Weighted Average PE Ratio | 29.20 |
| Weighted Average Price to Sales Ratio | 6.365 |
| Weighted Average Price to Book Ratio | 7.066 |
| Weighted Median ROE | 34.11% |
| Weighted Median ROA | 9.01% |
| ROI (TTM) | 14.76% |
| Return on Investment (TTM) | 14.76% |
| Earning Yield | 0.0478 |
| LT Debt / Shareholders Equity | 0.9195 |
| Number of Equity Holdings | 0 |
| Bond | |
| Yield to Maturity (12-31-25) | 4.28% |
| Effective Duration | -- |
| Average Coupon | 3.71% |
| Calculated Average Quality | 2.328 |
| Effective Maturity | 12.09 |
| Nominal Maturity | 12.15 |
| Number of Bond Holdings | 0 |
As of December 31, 2025
Growth Metrics
| EPS Growth (1Y) | 24.83% |
| EPS Growth (3Y) | 13.31% |
| EPS Growth (5Y) | 16.76% |
| Sales Growth (1Y) | 12.48% |
| Sales Growth (3Y) | 11.87% |
| Sales Growth (5Y) | 12.46% |
| Sales per Share Growth (1Y) | 47.22% |
| Sales per Share Growth (3Y) | 11.63% |
| Operating Cash Flow - Growth Rate (3Y) | 16.33% |
As of December 31, 2025
Fund Details
| Key Dates | |
| Inception Date | 1/23/2012 |
| Last Annual Report Date | 12/31/2025 |
| Last Prospectus Date | 4/30/2026 |
| Attributes | |
| Index Fund | -- |
| Inverse Fund | No |
| Leveraged Fund | -- |
| Fund of Funds |
|
| Currency Hedged Fund | -- |
| Socially Responsible Fund | No |
Top Portfolio Holders
| Name | % Weight |
|---|---|
| Portfolio A | 5.00% |
| Portfolio B | 3.50% |
| Portfolio C | 2.25% |
Excel Add-In Codes
| Name: =YCI("M:SFBPX", "name") |
| Broad Asset Class: =YCI("M:SFBPX", "broad_asset_class") |
| Broad Category: =YCI("M:SFBPX", "broad_category_group") |
| Prospectus Objective: =YCI("M:SFBPX", "prospectus_objective") |
| To find the codes for any of our securities and financial metrics, see our Complete Excel Reference. |