

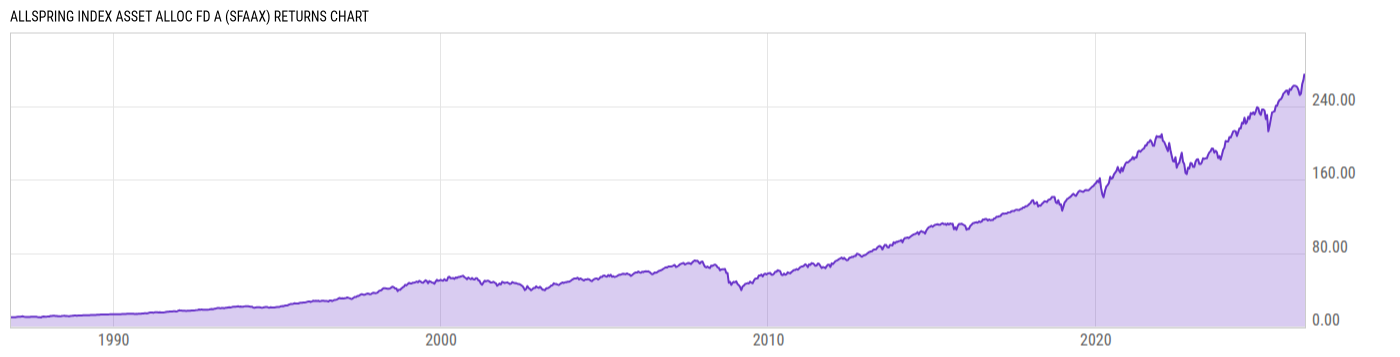
Allspring Index Asset Alloc Fd A (SFAAX)
40.18
+0.09
(+0.22%)
USD |
May 22 2026
Returns Chart
Key Stats
| Net Expense Ratio | Total Assets Under Management | Weighted Average Dividend Yield | Turnover Ratio (Generic) |
|---|---|---|---|
| 1.07% | 1.230B | 1.13% | 19.00% |
| 1 Year Fund Level Flows | 1 Year Total Returns (Daily) | Annualized Total Returns Since Inception (Daily) | Max Drawdown (Since Inception) |
| -203.71M | 18.70% |
Basic Info
| Investment Strategy | |
| The Fund seeks long term total return. The Fund will invest at least 80% its net assets in equity and fixed income securities designed to replicate the holdings and weightings of the securities comprising the S&P 500 Index and Barclays Capital 20+ Treasury Index. |
| General | |
| Security Type | Mutual Fund |
| Equity Style | Large Cap Core |
| Broad Asset Class | Allocation |
| Broad Category | Allocation |
| Global Peer Group | Mixed Asset USD Balanced - US |
| Peer Group | Mixed-Asset Target Alloc Moderate Funds |
| Global Macro | Mixed Asset HC Balanced |
| US Macro | Mixed-Assets Target Allocation Funds |
| YCharts Categorization | -- |
| YCharts Benchmark | -- |
| Prospectus Objective | Growth Funds |
| Fund Owner Firm Name | Allspring |
| Broad Asset Class Benchmark Index | |
| ^SPXTR | 100.0% |
Net Fund Flows Versus Peer Group
1 Month
% Rank:
80
-259.73M
Peer Group Low
518.99M
Peer Group High
1 Year
% Rank:
77
-203.71M
-5.437B
Peer Group Low
654.25M
Peer Group High
3 Months
% Rank:
76
-1.199B
Peer Group Low
597.16M
Peer Group High
3 Years
% Rank:
76
-21.54B
Peer Group Low
3.106B
Peer Group High
6 Months
% Rank:
78
-3.694B
Peer Group Low
582.67M
Peer Group High
5 Years
% Rank:
75
-30.31B
Peer Group Low
2.725B
Peer Group High
YTD
% Rank:
76
-1.525B
Peer Group Low
591.77M
Peer Group High
10 Years
% Rank:
62
-51.28B
Peer Group Low
3.796B
Peer Group High
Date Unavailable
Risk
Performance Versus Peer Group
Annual Total Returns Versus Peers
As of May 24, 2026.
Asset Allocation
As of February 28, 2026.
| Type | % Net |
|---|---|
| Cash | 2.64% |
| Stock | 59.64% |
| Bond | 37.55% |
| Convertible | 0.00% |
| Preferred | 0.00% |
| Other | 0.16% |
Top 10 Holdings
| Name | % Weight | Price | % Change |
|---|---|---|---|
|
EMINI S&P MAR26
|
10.95% | -- | -- |
| NVIDIA Corp. | 4.37% | 215.33 | -1.90% |
| Apple, Inc. | 3.96% | 308.82 | 1.26% |
|
10Y TNotes JUN26
|
3.55% | -- | -- |
| Microsoft Corp. | 2.96% | 418.57 | -0.12% |
| Allspring Govt Money Market Fund Sel | 2.70% | 1.00 | 0.00% |
| Amazon.com, Inc. | 2.07% | 266.32 | -0.80% |
| Alphabet, Inc. | 1.84% | 382.97 | -1.21% |
| United States of America USGB 1.375 10/31/2028 FIX USD Government | 1.81% | 93.62 | -0.10% |
| United States of America USGB 6.125 08/15/2029 FIX USD Government | 1.73% | 105.77 | -0.15% |
Fees & Availability
| Fees | |
| Actual 12B-1 Fee | -- |
| Actual Management Fee | 0.60% |
| Administration Fee | 1.87M% |
| Maximum Front Load | 5.75% |
| Maximum Deferred Load | -- |
| Maximum Redemption Fee | -- |
| General Availability | |
| Available for Insurance Product | No |
| Available for RRSP | No |
| Purchase Details | |
| Open to New Investors |
|
| Minimum Initial Investment | 1000.00 None |
| Minimum Subsequent Investment | 100.00 None |
Basic Info
| Investment Strategy | |
| The Fund seeks long term total return. The Fund will invest at least 80% its net assets in equity and fixed income securities designed to replicate the holdings and weightings of the securities comprising the S&P 500 Index and Barclays Capital 20+ Treasury Index. |
| General | |
| Security Type | Mutual Fund |
| Equity Style | Large Cap Core |
| Broad Asset Class | Allocation |
| Broad Category | Allocation |
| Global Peer Group | Mixed Asset USD Balanced - US |
| Peer Group | Mixed-Asset Target Alloc Moderate Funds |
| Global Macro | Mixed Asset HC Balanced |
| US Macro | Mixed-Assets Target Allocation Funds |
| YCharts Categorization | -- |
| YCharts Benchmark | -- |
| Prospectus Objective | Growth Funds |
| Fund Owner Firm Name | Allspring |
| Broad Asset Class Benchmark Index | |
| ^SPXTR | 100.0% |
Fundamentals
| General | |
| Distribution Yield | -- |
| Dividend Yield TTM (5-21-26) | 1.01% |
| 30-Day SEC Yield | -- |
| 7-Day SEC Yield | -- |
| Number of Holdings | 613 |
| Stock | |
| Weighted Average PE Ratio | 32.42 |
| Weighted Average Price to Sales Ratio | 8.131 |
| Weighted Average Price to Book Ratio | 11.24 |
| Weighted Median ROE | 114.0% |
| Weighted Median ROA | 17.38% |
| ROI (TTM) | 24.58% |
| Return on Investment (TTM) | 24.58% |
| Earning Yield | 0.0371 |
| LT Debt / Shareholders Equity | 0.8025 |
| Number of Equity Holdings | 503 |
| Bond | |
| Yield to Maturity (2-28-26) | 3.76% |
| Effective Duration | 5.71 |
| Average Coupon | 2.71% |
| Calculated Average Quality | 2.000 |
| Effective Maturity | 7.676 |
| Nominal Maturity | 7.676 |
| Number of Bond Holdings | 101 |
As of February 28, 2026
Growth Metrics
| EPS Growth (1Y) | 23.56% |
| EPS Growth (3Y) | 20.05% |
| EPS Growth (5Y) | 24.83% |
| Sales Growth (1Y) | 14.84% |
| Sales Growth (3Y) | 15.19% |
| Sales Growth (5Y) | 15.87% |
| Sales per Share Growth (1Y) | 15.93% |
| Sales per Share Growth (3Y) | 15.98% |
| Operating Cash Flow - Growth Rate (3Y) | 25.69% |
As of February 28, 2026
Top Portfolio Holders
| Name | % Weight |
|---|---|
| Portfolio A | 5.00% |
| Portfolio B | 3.50% |
| Portfolio C | 2.25% |
Excel Add-In Codes
| Name: =YCI("M:SFAAX", "name") |
| Broad Asset Class: =YCI("M:SFAAX", "broad_asset_class") |
| Broad Category: =YCI("M:SFAAX", "broad_category_group") |
| Prospectus Objective: =YCI("M:SFAAX", "prospectus_objective") |
| To find the codes for any of our securities and financial metrics, see our Complete Excel Reference. |