

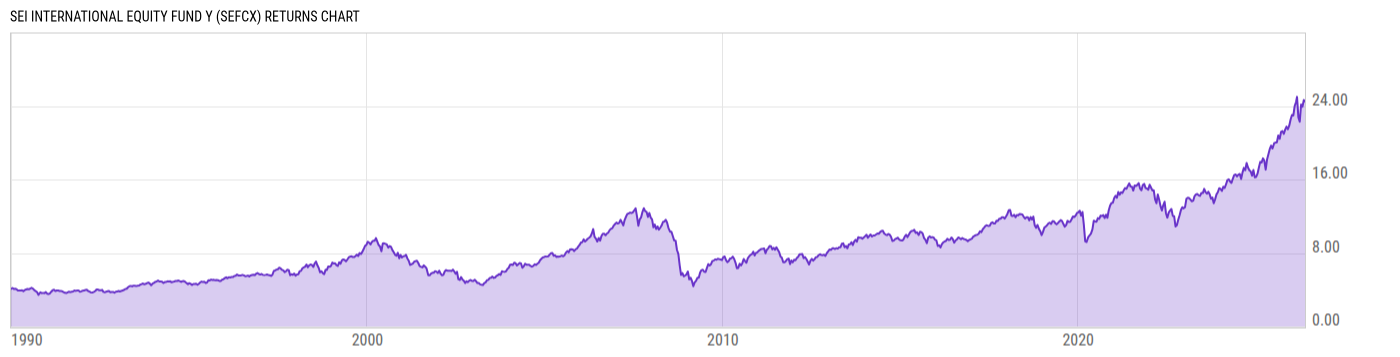
SEI International Equity Fund Y (SEFCX)
14.02
-0.02
(-0.14%)
USD |
Jun 09 2026
Returns Chart
Key Stats
| Net Expense Ratio | Total Assets Under Management | Weighted Average Dividend Yield | Turnover Ratio (Generic) |
|---|---|---|---|
| 0.87% | 3.597B | 2.97% | 89.00% |
| 1 Year Fund Level Flows | 1 Year Total Returns (Daily) | Annualized Total Returns Since Inception (Daily) | Max Drawdown (Since Inception) |
| -760.82M | 23.47% |
Basic Info
| Investment Strategy | |
| The Portfolio seeks to provide long-term capital appreciation by investing primarily in a diversified portfolio of equity securities of non U.S. issuers. |
| General | |
| Security Type | Mutual Fund |
| Equity Style | Multi Cap Core |
| Broad Asset Class | International Equity |
| Broad Category | Equity |
| Global Peer Group | Equity Global ex US |
| Peer Group | International Multi-Cap Core |
| Global Macro | Equity Global |
| US Macro | Developed International Markets Funds |
| YCharts Categorization | -- |
| YCharts Benchmark | -- |
| Prospectus Objective | International Funds |
| Fund Owner Firm Name | SEI |
| Broad Asset Class Benchmark Index | |
| ^MSACXUSNTR | 100.0% |
Net Fund Flows Versus Peer Group
1 Month
% Rank:
84
-646.86M
Peer Group Low
1.249B
Peer Group High
1 Year
% Rank:
93
-760.82M
-2.585B
Peer Group Low
21.10B
Peer Group High
3 Months
% Rank:
86
-549.38M
Peer Group Low
4.345B
Peer Group High
3 Years
% Rank:
94
-7.696B
Peer Group Low
38.72B
Peer Group High
6 Months
% Rank:
94
-1.564B
Peer Group Low
11.05B
Peer Group High
5 Years
% Rank:
94
-14.83B
Peer Group Low
61.92B
Peer Group High
YTD
% Rank:
92
-2.573B
Peer Group Low
7.616B
Peer Group High
10 Years
% Rank:
91
-43.26B
Peer Group Low
117.68B
Peer Group High
Date Unavailable
Risk
Performance Versus Peer Group
Annual Total Returns Versus Peers
As of June 10, 2026.
Asset Allocation
As of April 30, 2026.
| Type | % Net |
|---|---|
| Cash | 2.36% |
| Stock | 92.09% |
| Bond | 3.55% |
| Convertible | 0.00% |
| Preferred | 0.76% |
| Other | 1.24% |
Top 10 Holdings
| Name | % Weight | Price | % Change |
|---|---|---|---|
| United States of America USGB 0.0 08/27/2026 FIX USD Government | 2.39% | 99.21 | 0.01% |
| SEI Government Fund Institutional | 1.98% | 1.00 | 0.00% |
| Novartis AG | 1.48% | 144.88 | 0.00% |
| Roche Holding AG | 1.44% | 399.00 | 0.55% |
|
USD Cash
|
1.41% | -- | -- |
| HSBC Holdings Plc | 1.33% | 17.64 | -0.42% |
| ING Groep NV | 1.07% | 29.60 | 1.14% |
| GSK Plc | 0.95% | 24.66 | 0.00% |
| Equinor ASA | 0.92% | 36.19 | -4.32% |
| Eni SpA | 0.81% | 26.05 | 0.00% |
Fees & Availability
| Fees | |
| Actual 12B-1 Fee | -- |
| Actual Management Fee | 0.51% |
| Administration Fee | 897.1K% |
| Maximum Front Load | -- |
| Maximum Deferred Load | -- |
| Maximum Redemption Fee | 0.75% |
| General Availability | |
| Available for Insurance Product | No |
| Available for RRSP | No |
| Purchase Details | |
| Open to New Investors |
|
| Minimum Initial Investment | 100000.0 None |
| Minimum Subsequent Investment | 1000.00 None |
Basic Info
| Investment Strategy | |
| The Portfolio seeks to provide long-term capital appreciation by investing primarily in a diversified portfolio of equity securities of non U.S. issuers. |
| General | |
| Security Type | Mutual Fund |
| Equity Style | Multi Cap Core |
| Broad Asset Class | International Equity |
| Broad Category | Equity |
| Global Peer Group | Equity Global ex US |
| Peer Group | International Multi-Cap Core |
| Global Macro | Equity Global |
| US Macro | Developed International Markets Funds |
| YCharts Categorization | -- |
| YCharts Benchmark | -- |
| Prospectus Objective | International Funds |
| Fund Owner Firm Name | SEI |
| Broad Asset Class Benchmark Index | |
| ^MSACXUSNTR | 100.0% |
Fundamentals
| General | |
| Distribution Yield | -- |
| Dividend Yield TTM (6-8-26) | 3.37% |
| 30-Day SEC Yield (3-31-26) | 0.00% |
| 7-Day SEC Yield | -- |
| Number of Holdings | 1012 |
| Stock | |
| Weighted Average PE Ratio | 21.77 |
| Weighted Average Price to Sales Ratio | 3.146 |
| Weighted Average Price to Book Ratio | 3.899 |
| Weighted Median ROE | 18.51% |
| Weighted Median ROA | 6.44% |
| ROI (TTM) | 11.78% |
| Return on Investment (TTM) | 11.78% |
| Earning Yield | 0.0611 |
| LT Debt / Shareholders Equity | 0.7705 |
| Number of Equity Holdings | 979 |
As of April 30, 2026
Growth Metrics
| EPS Growth (1Y) | 17.49% |
| EPS Growth (3Y) | 9.95% |
| EPS Growth (5Y) | 17.66% |
| Sales Growth (1Y) | 4.76% |
| Sales Growth (3Y) | 5.10% |
| Sales Growth (5Y) | 8.24% |
| Sales per Share Growth (1Y) | 6.51% |
| Sales per Share Growth (3Y) | 6.44% |
| Operating Cash Flow - Growth Rate (3Y) | 11.50% |
As of April 30, 2026
Fund Details
Top Portfolio Holders
| Name | % Weight |
|---|---|
| Portfolio A | 5.00% |
| Portfolio B | 3.50% |
| Portfolio C | 2.25% |
Excel Add-In Codes
| Name: =YCI("M:SEFCX", "name") |
| Broad Asset Class: =YCI("M:SEFCX", "broad_asset_class") |
| Broad Category: =YCI("M:SEFCX", "broad_category_group") |
| Prospectus Objective: =YCI("M:SEFCX", "prospectus_objective") |
| To find the codes for any of our securities and financial metrics, see our Complete Excel Reference. |