

Western Asset Income Fund C1 (SDSIX)
4.97
0.00 (0.00%)
USD |
Jun 08 2026
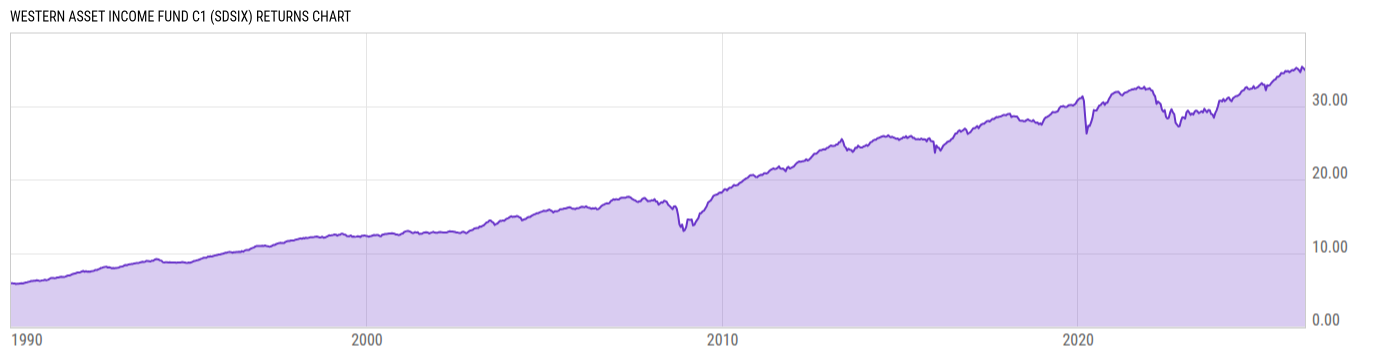
Returns Chart
Key Stats
| Net Expense Ratio | Total Assets Under Management | Weighted Average Dividend Yield | Turnover Ratio (Generic) |
|---|---|---|---|
| 1.40% | 327.97M | -- | 95.00% |
| 1 Year Fund Level Flows | 1 Year Total Returns (Daily) | Annualized Total Returns Since Inception (Daily) | Max Drawdown (Since Inception) |
| -99.33M | 5.97% |
Basic Info
| Investment Strategy | |
| The Fund seeks high current income. The Fund normally invests in a globally diverse portfolio of fixed income securities. The Fund has discretion to invest in all types of fixed income securities and to allocate the fund's assets among all segments of the global market for fixed income securities. |
| General | |
| Security Type | Mutual Fund |
| Equity Style | -- |
| Broad Asset Class | Taxable Bond |
| Broad Category | Fixed Income |
| Global Peer Group | Bond Global USD |
| Peer Group | Multi-Sector Income Funds |
| Global Macro | Bond Global |
| US Macro | General Domestic Taxable Fixed Income Funds |
| YCharts Categorization | -- |
| YCharts Benchmark | -- |
| Prospectus Objective | Multi-Sector Income Funds |
| Fund Owner Firm Name | Franklin Templeton |
| Broad Asset Class Benchmark Index | |
| ^BBUSATR | 100.0% |
Net Fund Flows Versus Peer Group
1 Month
% Rank:
83
-144.76M
Peer Group Low
572.86M
Peer Group High
1 Year
% Rank:
87
-99.33M
-1.545B
Peer Group Low
30.94B
Peer Group High
3 Months
% Rank:
72
-480.71M
Peer Group Low
1.683B
Peer Group High
3 Years
% Rank:
89
-4.573B
Peer Group Low
71.08B
Peer Group High
6 Months
% Rank:
76
-777.58M
Peer Group Low
12.53B
Peer Group High
5 Years
% Rank:
87
-7.509B
Peer Group Low
61.00B
Peer Group High
YTD
% Rank:
76
-627.92M
Peer Group Low
8.773B
Peer Group High
10 Years
% Rank:
81
-13.91B
Peer Group Low
116.77B
Peer Group High
Date Unavailable
Risk
Performance Versus Peer Group
Annual Total Returns Versus Peers
As of June 09, 2026.
Asset Allocation
As of March 31, 2026.
| Type | % Net |
|---|---|
| Cash | 2.86% |
| Stock | 0.16% |
| Bond | 97.25% |
| Convertible | 0.00% |
| Preferred | 0.00% |
| Other | -0.27% |
Top 10 Holdings
| Name | % Weight | Price | % Change |
|---|---|---|---|
| MCCLATCHY MEDIA COMPANY, LLC MCCLMED 11.0 12/01/2031 FIX USD Corporate 144A | 2.86% | 115.11 | 7.16% |
|
USD Cash
|
2.31% | -- | -- |
|
USD/MXN Forward Contract
|
1.29% | -- | -- |
|
Mexico (United Mexican States) (Government) 7.75% 23-NOV-2034
|
1.06% | -- | -- |
|
USD/GBP Forward Contract
|
1.03% | -- | -- |
|
New Generation Gas LLC FRN 30-Sep-2029
|
0.90% | -- | -- |
|
Brazil, Federative Republic of (Government) 10% 01-JAN-2031
|
0.75% | -- | -- |
| PM GENERAL PURCHASER LLC PMGEN 9.5 10/01/2028 FIX USD Corporate 144A | 0.74% | 89.50 | 0.10% |
|
JPY/USD Forward Contract
|
0.71% | -- | -- |
| OCCIDENTAL PETROLEUM CORPORATION OXY 7.95 06/15/2039 FIX USD Corporate | 0.68% | 119.09 | -0.00% |
Fees & Availability
| Fees | |
| Actual 12B-1 Fee | 0.70% |
| Actual Management Fee | 0.50% |
| Administration Fee | -- |
| Maximum Front Load | 0.00% |
| Maximum Deferred Load | 1.00% |
| Maximum Redemption Fee | -- |
| General Availability | |
| Available for Insurance Product | No |
| Available for RRSP | No |
| Purchase Details | |
| Open to New Investors | No |
| Minimum Initial Investment | 1000.00 None |
| Minimum Subsequent Investment | 50.00 None |
Basic Info
| Investment Strategy | |
| The Fund seeks high current income. The Fund normally invests in a globally diverse portfolio of fixed income securities. The Fund has discretion to invest in all types of fixed income securities and to allocate the fund's assets among all segments of the global market for fixed income securities. |
| General | |
| Security Type | Mutual Fund |
| Equity Style | -- |
| Broad Asset Class | Taxable Bond |
| Broad Category | Fixed Income |
| Global Peer Group | Bond Global USD |
| Peer Group | Multi-Sector Income Funds |
| Global Macro | Bond Global |
| US Macro | General Domestic Taxable Fixed Income Funds |
| YCharts Categorization | -- |
| YCharts Benchmark | -- |
| Prospectus Objective | Multi-Sector Income Funds |
| Fund Owner Firm Name | Franklin Templeton |
| Broad Asset Class Benchmark Index | |
| ^BBUSATR | 100.0% |
Fundamentals
| General | |
| Distribution Yield | -- |
| Dividend Yield TTM (6-5-26) | 6.33% |
| 30-Day SEC Yield (4-30-26) | 5.79% |
| 7-Day SEC Yield | -- |
| Number of Holdings | 592 |
| Bond | |
| Yield to Maturity (3-31-26) | 7.35% |
| Effective Duration | 4.18 |
| Average Coupon | 7.18% |
| Calculated Average Quality | 4.935 |
| Effective Maturity | 9.760 |
| Nominal Maturity | 10.22 |
| Number of Bond Holdings | 517 |
As of March 31, 2026
Fund Details
Top Portfolio Holders
| Name | % Weight |
|---|---|
| Portfolio A | 5.00% |
| Portfolio B | 3.50% |
| Portfolio C | 2.25% |
Excel Add-In Codes
| Name: =YCI("M:SDSIX", "name") |
| Broad Asset Class: =YCI("M:SDSIX", "broad_asset_class") |
| Broad Category: =YCI("M:SDSIX", "broad_category_group") |
| Prospectus Objective: =YCI("M:SDSIX", "prospectus_objective") |
| To find the codes for any of our securities and financial metrics, see our Complete Excel Reference. |