

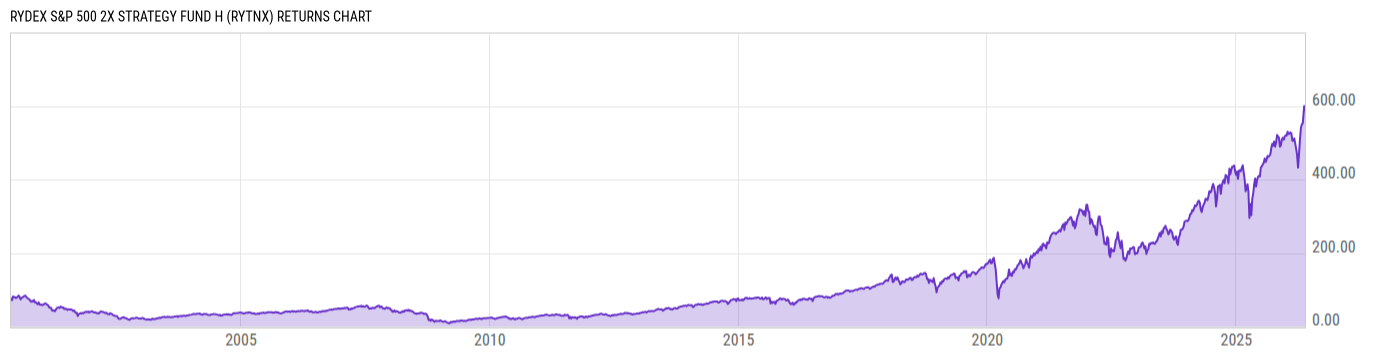
Rydex S&P 500 2x Strategy Fund H (RYTNX)
437.21
-2.36
(-0.54%)
USD |
Jun 09 2026
Returns Chart
Key Stats
| Net Expense Ratio | Total Assets Under Management | Weighted Average Dividend Yield | Turnover Ratio (Generic) |
|---|---|---|---|
| 1.74% | 219.77M | 1.13% | 1.20K% |
| 1 Year Fund Level Flows | 1 Year Total Returns (Daily) | Annualized Total Returns Since Inception (Daily) | Max Drawdown (Since Inception) |
| -128.32M | 42.43% |
Basic Info
| Investment Strategy | |
| The Fund seeks to provide investment results that match the 200% performance of the S&P 500 Index on a daily basis. The S&P 500 Index is a capitalization-weighted index composed of 500 common stocks, which are chosen by the Standard & Poors Corporation and which generally represent large-capitalization companies. |
| General | |
| Security Type | Mutual Fund |
| Equity Style | Large Cap Core |
| Broad Asset Class | Miscellaneous |
| Broad Category | Alternative Strategies |
| Global Peer Group | Alternative Equity Leveraged |
| Peer Group | Equity Leverage Funds |
| Global Macro | Alternative Equity |
| US Macro | Large-Cap Funds |
| YCharts Categorization | -- |
| YCharts Benchmark | -- |
| Prospectus Objective | Equity Leverage Funds |
| Fund Owner Firm Name | Guggenheim |
| Broad Asset Class Benchmark Index | |
| ^SPXTR | 100.0% |
Net Fund Flows Versus Peer Group
1 Month
% Rank:
97
-4.055B
Peer Group Low
975.45M
Peer Group High
1 Year
% Rank:
94
-128.32M
-27.57B
Peer Group Low
1.456B
Peer Group High
3 Months
% Rank:
94
-9.773B
Peer Group Low
920.26M
Peer Group High
3 Years
% Rank:
94
-25.86B
Peer Group Low
2.278B
Peer Group High
6 Months
% Rank:
90
-17.93B
Peer Group Low
1.141B
Peer Group High
5 Years
% Rank:
95
-23.37B
Peer Group Low
2.278B
Peer Group High
YTD
% Rank:
95
-16.45B
Peer Group Low
1.044B
Peer Group High
10 Years
% Rank:
94
-21.99B
Peer Group Low
6.033B
Peer Group High
Date Unavailable
Risk
Performance Versus Peer Group
Annual Total Returns Versus Peers
As of June 10, 2026.
Asset Allocation
As of March 31, 2026.
| Type | % Net |
|---|---|
| Cash | 4.62% |
| Stock | 83.47% |
| Bond | 8.51% |
| Convertible | 0.00% |
| Preferred | 0.00% |
| Other | 3.41% |
Top 10 Holdings
| Name | % Weight | Price | % Change |
|---|---|---|---|
| NVIDIA Corp. | 6.33% | 208.19 | -0.22% |
| United States of America USGB 05/21/2026 FIX USD Government (Matured) | 6.03% | 100.00 | 0.01% |
| Apple, Inc. | 5.56% | 290.55 | -3.64% |
|
Other Assets less Liabilities
|
5.22% | -- | -- |
| Microsoft Corp. | 4.10% | 403.41 | -2.02% |
| Amazon.com, Inc. | 3.04% | 244.19 | -0.42% |
|
USD Cash
|
2.81% | -- | -- |
| Alphabet, Inc. | 2.50% | 364.26 | 0.26% |
| BNY Dreyfus Treasury Obligations Cash Mgmt Inst | 2.29% | 1.00 | 0.00% |
| Broadcom Inc. | 2.19% | 392.16 | -1.12% |
Fees & Availability
| Fees | |
| Actual 12B-1 Fee | 0.25% |
| Actual Management Fee | 0.80% |
| Administration Fee | -- |
| Maximum Front Load | -- |
| Maximum Deferred Load | -- |
| Maximum Redemption Fee | -- |
| General Availability | |
| Available for Insurance Product | No |
| Available for RRSP | No |
| Purchase Details | |
| Open to New Investors |
|
| Minimum Initial Investment | 2500.00 None |
| Minimum Subsequent Investment | 0.00 None |
Basic Info
| Investment Strategy | |
| The Fund seeks to provide investment results that match the 200% performance of the S&P 500 Index on a daily basis. The S&P 500 Index is a capitalization-weighted index composed of 500 common stocks, which are chosen by the Standard & Poors Corporation and which generally represent large-capitalization companies. |
| General | |
| Security Type | Mutual Fund |
| Equity Style | Large Cap Core |
| Broad Asset Class | Miscellaneous |
| Broad Category | Alternative Strategies |
| Global Peer Group | Alternative Equity Leveraged |
| Peer Group | Equity Leverage Funds |
| Global Macro | Alternative Equity |
| US Macro | Large-Cap Funds |
| YCharts Categorization | -- |
| YCharts Benchmark | -- |
| Prospectus Objective | Equity Leverage Funds |
| Fund Owner Firm Name | Guggenheim |
| Broad Asset Class Benchmark Index | |
| ^SPXTR | 100.0% |
Fundamentals
| General | |
| Distribution Yield | -- |
| Dividend Yield TTM (6-8-26) | 0.27% |
| 30-Day SEC Yield | -- |
| 7-Day SEC Yield | -- |
| Number of Holdings | 512 |
| Stock | |
| Weighted Average PE Ratio | 30.95 |
| Weighted Average Price to Sales Ratio | 7.666 |
| Weighted Average Price to Book Ratio | 10.87 |
| Weighted Median ROE | 111.2% |
| Weighted Median ROA | 17.58% |
| ROI (TTM) | 24.74% |
| Return on Investment (TTM) | 24.74% |
| Earning Yield | 0.0391 |
| LT Debt / Shareholders Equity | 0.7245 |
| Number of Equity Holdings | 503 |
| Bond | |
| Yield to Maturity (3-31-26) | 3.71% |
| Effective Duration | -- |
| Average Coupon | -- |
| Calculated Average Quality | -- |
| Effective Maturity | 0.1505 |
| Nominal Maturity | 0.1505 |
| Number of Bond Holdings | 2 |
As of March 31, 2026
Growth Metrics
| EPS Growth (1Y) | 23.56% |
| EPS Growth (3Y) | 20.17% |
| EPS Growth (5Y) | 25.63% |
| Sales Growth (1Y) | 15.05% |
| Sales Growth (3Y) | 15.38% |
| Sales Growth (5Y) | 16.15% |
| Sales per Share Growth (1Y) | 16.00% |
| Sales per Share Growth (3Y) | 16.09% |
| Operating Cash Flow - Growth Rate (3Y) | 26.32% |
As of March 31, 2026
Top Portfolio Holders
| Name | % Weight |
|---|---|
| Portfolio A | 5.00% |
| Portfolio B | 3.50% |
| Portfolio C | 2.25% |
Excel Add-In Codes
| Name: =YCI("M:RYTNX", "name") |
| Broad Asset Class: =YCI("M:RYTNX", "broad_asset_class") |
| Broad Category: =YCI("M:RYTNX", "broad_category_group") |
| Prospectus Objective: =YCI("M:RYTNX", "prospectus_objective") |
| To find the codes for any of our securities and financial metrics, see our Complete Excel Reference. |