

RiverPark Strategic Income Fund Retail (RSIVX)
8.542
0.00 (0.00%)
USD |
May 22 2026
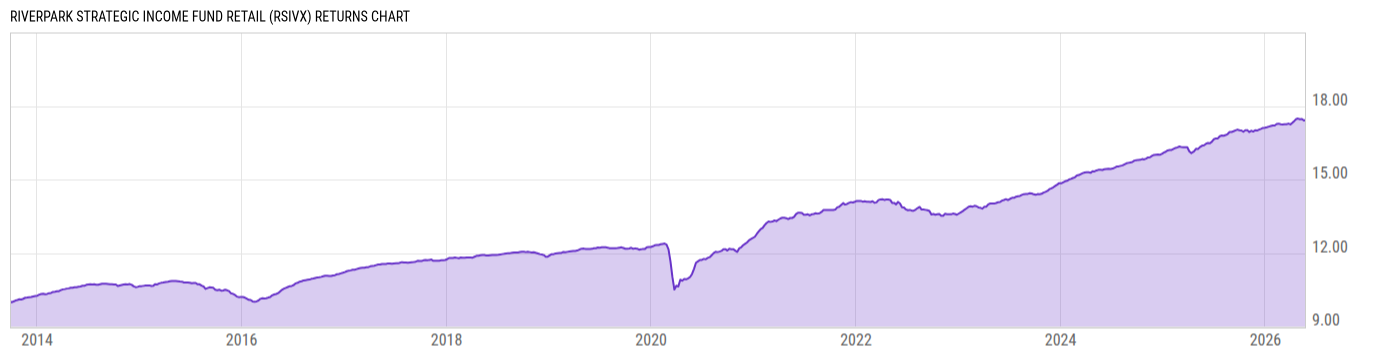
Returns Chart
Key Stats
| Net Expense Ratio | Total Assets Under Management | Weighted Average Dividend Yield | Turnover Ratio (Generic) |
|---|---|---|---|
| 1.25% | 620.69M | -- | 100.0% |
| 1 Year Fund Level Flows | 1 Year Total Returns (Daily) | Annualized Total Returns Since Inception (Daily) | Max Drawdown (Since Inception) |
| -16.91M | 6.49% |
Basic Info
| Investment Strategy | |
| The Fund seeks high current income and capital appreciation consistent with the preservation of capital. It will invest at least 80% of its net assets (plus amount of any borrowings for investment purposes) in fixed income securities and income producing equities and in various credit qualities and maturities. |
| General | |
| Security Type | Mutual Fund |
| Equity Style | -- |
| Broad Asset Class | Allocation |
| Broad Category | Allocation |
| Global Peer Group | Mixed Asset USD Flexible - US |
| Peer Group | Flexible Portfolio Funds |
| Global Macro | Mixed Asset HC Flexible |
| US Macro | Mixed-Assets Funds |
| YCharts Categorization | -- |
| YCharts Benchmark | -- |
| Prospectus Objective | Flexible Portfolio Funds |
| Fund Owner Firm Name | RiverPark Funds |
| Broad Asset Class Benchmark Index | |
| ^SPXTR | 100.0% |
Net Fund Flows Versus Peer Group
1 Month
% Rank:
56
-159.25M
Peer Group Low
6.112B
Peer Group High
1 Year
% Rank:
55
-16.91M
-3.214B
Peer Group Low
6.112B
Peer Group High
3 Months
% Rank:
72
-582.29M
Peer Group Low
6.112B
Peer Group High
3 Years
% Rank:
6
-12.12B
Peer Group Low
6.112B
Peer Group High
6 Months
% Rank:
70
-1.396B
Peer Group Low
6.112B
Peer Group High
5 Years
% Rank:
8
-14.74B
Peer Group Low
6.112B
Peer Group High
YTD
% Rank:
65
-927.39M
Peer Group Low
6.112B
Peer Group High
10 Years
% Rank:
66
-47.38B
Peer Group Low
9.619B
Peer Group High
Date Unavailable
Risk
Performance Versus Peer Group
Annual Total Returns Versus Peers
As of May 25, 2026.
Asset Allocation
As of March 31, 2026.
| Type | % Net |
|---|---|
| Cash | 8.96% |
| Stock | 11.04% |
| Bond | 72.11% |
| Convertible | 0.00% |
| Preferred | 2.38% |
| Other | 5.51% |
Top 10 Holdings
| Name | % Weight | Price | % Change |
|---|---|---|---|
| First American Treasury Obligations Fund X | 4.94% | 1.00 | 0.00% |
|
Other Assets less Liabilities
|
3.69% | -- | -- |
|
Forum Energy Technologies Inc 10.5% 07-NOV-2029
|
2.86% | -- | -- |
|
CMG Media Corp FRN 18-Jun-2029
|
2.81% | -- | -- |
|
Canopy Growth Corp 08-JAN-2031 Term Loan
|
2.49% | -- | -- |
|
888 Acquisitions Ltd 10.75% 15-MAY-2030
|
2.39% | -- | -- |
| COMPASS GROUP DIVERSIFIED HOLDINGS LLC COMPAGR 5.25 04/15/2029 FIX USD Corporate 144A | 2.37% | 95.71 | 0.12% |
| GrubHub Holdings Inc. GRUBHOL 7.0 07/31/2030 VAR USD Corporate 144A | 2.19% | 80.07 | -0.08% |
|
TPC Group Inc 22-NOV-2031 Term Loan B
|
2.10% | -- | -- |
| Edison International EIX 04/17/2026 FIX USD Corporate (Matured) | 2.03% | 99.99 | 0.01% |
Fees & Availability
| Fees | |
| Actual 12B-1 Fee | 0.25% |
| Actual Management Fee | 0.65% |
| Administration Fee | 23.38K% |
| Maximum Front Load | -- |
| Maximum Deferred Load | -- |
| Maximum Redemption Fee | -- |
| General Availability | |
| Available for Insurance Product | No |
| Available for RRSP | No |
| Purchase Details | |
| Open to New Investors |
|
| Minimum Initial Investment | 2500.00 None |
| Minimum Subsequent Investment | 0.00 None |
Basic Info
| Investment Strategy | |
| The Fund seeks high current income and capital appreciation consistent with the preservation of capital. It will invest at least 80% of its net assets (plus amount of any borrowings for investment purposes) in fixed income securities and income producing equities and in various credit qualities and maturities. |
| General | |
| Security Type | Mutual Fund |
| Equity Style | -- |
| Broad Asset Class | Allocation |
| Broad Category | Allocation |
| Global Peer Group | Mixed Asset USD Flexible - US |
| Peer Group | Flexible Portfolio Funds |
| Global Macro | Mixed Asset HC Flexible |
| US Macro | Mixed-Assets Funds |
| YCharts Categorization | -- |
| YCharts Benchmark | -- |
| Prospectus Objective | Flexible Portfolio Funds |
| Fund Owner Firm Name | RiverPark Funds |
| Broad Asset Class Benchmark Index | |
| ^SPXTR | 100.0% |
Fundamentals
| General | |
| Distribution Yield | -- |
| Dividend Yield TTM (5-21-26) | 7.93% |
| 30-Day SEC Yield (4-30-26) | 7.18% |
| 7-Day SEC Yield | -- |
| Number of Holdings | 144 |
| Stock | |
| Weighted Average PE Ratio | 33.49 |
| Weighted Average Price to Sales Ratio | 0.4661 |
| Weighted Average Price to Book Ratio | 1.383 |
| Weighted Median ROE | 4.76% |
| Weighted Median ROA | 2.15% |
| ROI (TTM) | 2.30% |
| Return on Investment (TTM) | 2.30% |
| Earning Yield | 0.0463 |
| LT Debt / Shareholders Equity | 1.693 |
| Number of Equity Holdings | 36 |
| Bond | |
| Yield to Maturity (3-31-26) | 7.23% |
| Effective Duration | -- |
| Average Coupon | 7.63% |
| Calculated Average Quality | 5.293 |
| Effective Maturity | 3.727 |
| Nominal Maturity | 4.030 |
| Number of Bond Holdings | 76 |
As of March 31, 2026
Growth Metrics
| EPS Growth (1Y) | 29.83% |
| EPS Growth (3Y) | -10.93% |
| EPS Growth (5Y) | -3.23% |
| Sales Growth (1Y) | 2.24% |
| Sales Growth (3Y) | -4.08% |
| Sales Growth (5Y) | -0.47% |
| Sales per Share Growth (1Y) | -3.17% |
| Sales per Share Growth (3Y) | -5.33% |
| Operating Cash Flow - Growth Rate (3Y) | 2.78% |
As of March 31, 2026
Fund Details
| Key Dates | |
| Inception Date | 9/30/2013 |
| Last Annual Report Date | 9/30/2025 |
| Last Prospectus Date | 1/28/2026 |
| Share Classes | |
| RSIIX | Inst |
| Attributes | |
| Index Fund | -- |
| Inverse Fund | No |
| Leveraged Fund | -- |
| Fund of Funds | No |
| Currency Hedged Fund | -- |
| Socially Responsible Fund | No |
Top Portfolio Holders
| Name | % Weight |
|---|---|
| Portfolio A | 5.00% |
| Portfolio B | 3.50% |
| Portfolio C | 2.25% |
Excel Add-In Codes
| Name: =YCI("M:RSIVX", "name") |
| Broad Asset Class: =YCI("M:RSIVX", "broad_asset_class") |
| Broad Category: =YCI("M:RSIVX", "broad_category_group") |
| Prospectus Objective: =YCI("M:RSIVX", "prospectus_objective") |
| To find the codes for any of our securities and financial metrics, see our Complete Excel Reference. |