

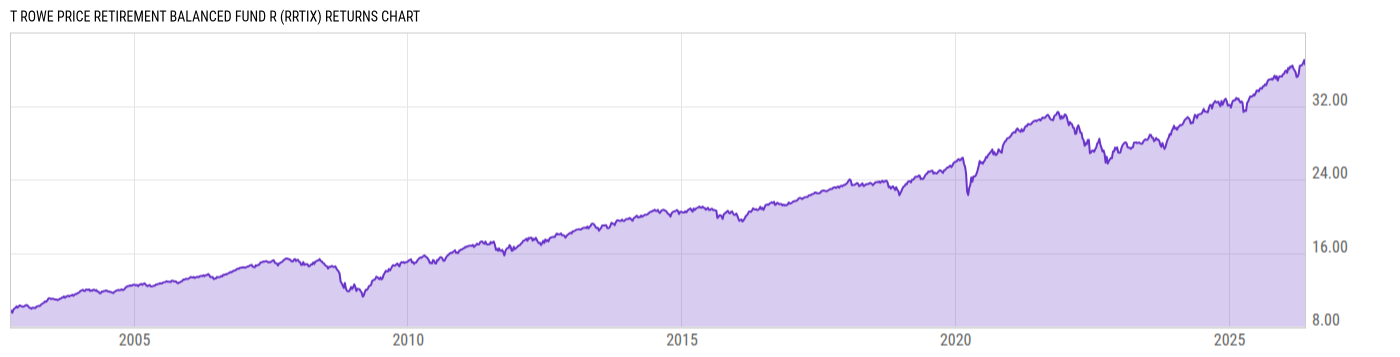
T Rowe Price Retirement Balanced Fund R (RRTIX)
14.47
+0.02
(+0.14%)
USD |
Jun 09 2026
Returns Chart
Key Stats
| Net Expense Ratio | Total Assets Under Management | Weighted Average Dividend Yield | Turnover Ratio (Generic) |
|---|---|---|---|
| 0.99% | 2.190B | -- | 19.00% |
| 1 Year Fund Level Flows | 1 Year Total Returns (Daily) | Annualized Total Returns Since Inception (Daily) | Max Drawdown (Since Inception) |
| -193.52M | 10.95% |
Basic Info
| Investment Strategy | |
| The Fund seeks the highest total return over time consistent with an emphasis on both capital growth and income. Under normal circumstances, the Fund pursues its objective by investing in a diversified portfolio of other T. Rowe Price stock and bond mutual funds that represent various asset classes and sectors. |
| General | |
| Security Type | Mutual Fund |
| Equity Style | -- |
| Broad Asset Class | Allocation |
| Broad Category | Allocation |
| Global Peer Group | Mixed Asset USD Balanced - US |
| Peer Group | Mixed-Asset Target Today Funds |
| Global Macro | Mixed Asset HC Balanced |
| US Macro | Mixed-Assets Target Date Funds |
| YCharts Categorization | -- |
| YCharts Benchmark | -- |
| Prospectus Objective | Income Funds |
| Fund Owner Firm Name | T. Rowe Price |
| Broad Asset Class Benchmark Index | |
| ^SPXTR | 100.0% |
Net Fund Flows Versus Peer Group
1 Month
% Rank:
76
-439.86M
Peer Group Low
24.02M
Peer Group High
1 Year
% Rank:
76
-193.52M
-2.883B
Peer Group Low
168.63M
Peer Group High
3 Months
% Rank:
77
-1.037B
Peer Group Low
70.52M
Peer Group High
3 Years
% Rank:
83
-10.21B
Peer Group Low
158.60M
Peer Group High
6 Months
% Rank:
76
-1.652B
Peer Group Low
120.79M
Peer Group High
5 Years
% Rank:
83
-14.75B
Peer Group Low
475.86M
Peer Group High
YTD
% Rank:
72
-1.388B
Peer Group Low
93.37M
Peer Group High
10 Years
% Rank:
83
-18.46B
Peer Group Low
1.158B
Peer Group High
Date Unavailable
Risk
Performance Versus Peer Group
Annual Total Returns Versus Peers
As of June 10, 2026.
Asset Allocation
As of March 31, 2026.
| Type | % Net |
|---|---|
| Cash | 2.38% |
| Stock | 38.19% |
| Bond | 58.17% |
| Convertible | 0.00% |
| Preferred | 0.14% |
| Other | 1.11% |
Top 10 Holdings
| Name | % Weight | Price | % Change |
|---|---|---|---|
| T Rowe Price Limited Duration Inflation Foc Bd Z | 21.09% | 4.71 | 0.21% |
| T Rowe Price New Income Fund Z | 16.92% | 7.88 | 0.13% |
| T Rowe Price International Bond Fd USD Hgd Z | 6.28% | 8.48 | 0.00% |
| T Rowe Price Value Fund Z | 6.02% | 53.89 | 0.60% |
| T Rowe Price Growth Stock Fund Z | 5.56% | 112.48 | -0.71% |
| T Rowe Price Hedged Equity Fund Z | 3.98% | 13.82 | -0.14% |
| T Rowe Price Dynamic Global Bond Fund Z | 3.75% | 7.62 | 0.26% |
| T Rowe Price Emerging Markets Bond Fund Z | 3.50% | 9.87 | 0.10% |
| T Rowe Price Equity Index 500 Fund Z | 3.37% | 192.09 | -0.25% |
| T Rowe Price US Large-Cap Core Fund Inc Z | 3.21% | 46.43 | 0.13% |
Fees & Availability
| Fees | |
| Actual 12B-1 Fee | 0.50% |
| Actual Management Fee | 0.49% |
| Administration Fee | -- |
| Maximum Front Load | -- |
| Maximum Deferred Load | -- |
| Maximum Redemption Fee | -- |
| General Availability | |
| Available for Insurance Product | No |
| Available for RRSP | No |
| Purchase Details | |
| Open to New Investors |
|
| Minimum Initial Investment | 2500.00 None |
| Minimum Subsequent Investment | 100.00 None |
Basic Info
| Investment Strategy | |
| The Fund seeks the highest total return over time consistent with an emphasis on both capital growth and income. Under normal circumstances, the Fund pursues its objective by investing in a diversified portfolio of other T. Rowe Price stock and bond mutual funds that represent various asset classes and sectors. |
| General | |
| Security Type | Mutual Fund |
| Equity Style | -- |
| Broad Asset Class | Allocation |
| Broad Category | Allocation |
| Global Peer Group | Mixed Asset USD Balanced - US |
| Peer Group | Mixed-Asset Target Today Funds |
| Global Macro | Mixed Asset HC Balanced |
| US Macro | Mixed-Assets Target Date Funds |
| YCharts Categorization | -- |
| YCharts Benchmark | -- |
| Prospectus Objective | Income Funds |
| Fund Owner Firm Name | T. Rowe Price |
| Broad Asset Class Benchmark Index | |
| ^SPXTR | 100.0% |
Fundamentals
| General | |
| Distribution Yield | -- |
| Dividend Yield TTM (6-8-26) | 2.78% |
| 30-Day SEC Yield (4-30-26) | 1.44% |
| 7-Day SEC Yield | -- |
| Number of Holdings | 27 |
| Stock | |
| Weighted Average PE Ratio | 30.29 |
| Weighted Average Price to Sales Ratio | 6.543 |
| Weighted Average Price to Book Ratio | 8.317 |
| Weighted Median ROE | 9.00% |
| Weighted Median ROA | 9.96% |
| ROI (TTM) | 13.26% |
| Return on Investment (TTM) | 13.26% |
| Earning Yield | 0.0430 |
| LT Debt / Shareholders Equity | 1.809 |
| Number of Equity Holdings | 0 |
| Bond | |
| Yield to Maturity (3-31-26) | 3.48% |
| Effective Duration | 5.13 |
| Average Coupon | 3.40% |
| Calculated Average Quality | 2.728 |
| Effective Maturity | 8.641 |
| Nominal Maturity | 8.733 |
| Number of Bond Holdings | 0 |
As of March 31, 2026
Growth Metrics
| EPS Growth (1Y) | 17.74% |
| EPS Growth (3Y) | 15.84% |
| EPS Growth (5Y) | 19.06% |
| Sales Growth (1Y) | 10.01% |
| Sales Growth (3Y) | 7.95% |
| Sales Growth (5Y) | 9.76% |
| Sales per Share Growth (1Y) | 26.08% |
| Sales per Share Growth (3Y) | 8.11% |
| Operating Cash Flow - Growth Rate (3Y) | 25.40% |
As of March 31, 2026
Top Portfolio Holders
| Name | % Weight |
|---|---|
| Portfolio A | 5.00% |
| Portfolio B | 3.50% |
| Portfolio C | 2.25% |
Excel Add-In Codes
| Name: =YCI("M:RRTIX", "name") |
| Broad Asset Class: =YCI("M:RRTIX", "broad_asset_class") |
| Broad Category: =YCI("M:RRTIX", "broad_category_group") |
| Prospectus Objective: =YCI("M:RRTIX", "prospectus_objective") |
| To find the codes for any of our securities and financial metrics, see our Complete Excel Reference. |