

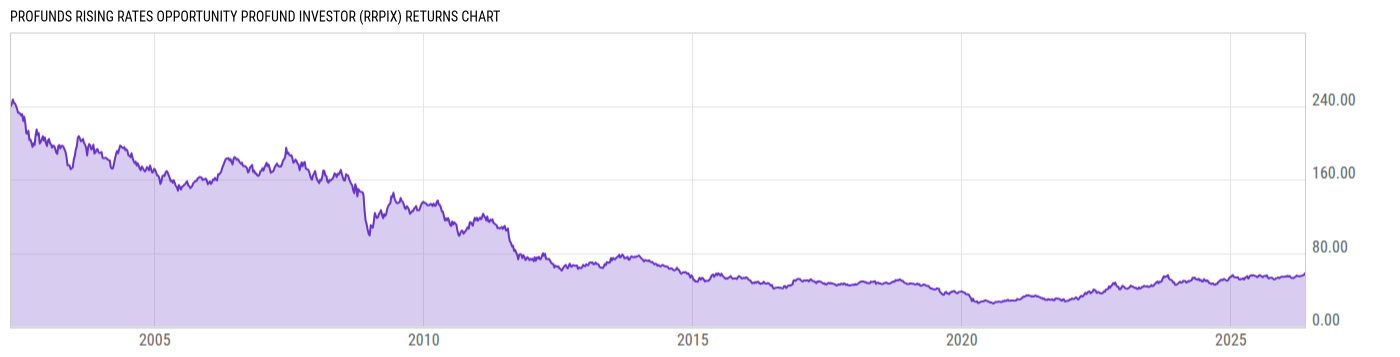
ProFunds Rising Rates Opportunity ProFund Investor (RRPIX)
42.80
+0.28
(+0.66%)
USD |
Jun 08 2026
Returns Chart
Key Stats
| Net Expense Ratio | Total Assets Under Management | Weighted Average Dividend Yield | Turnover Ratio (Generic) |
|---|---|---|---|
| 1.78% | 8.035M | -- | 1.30K% |
| 1 Year Fund Level Flows | 1 Year Total Returns (Daily) | Annualized Total Returns Since Inception (Daily) | Max Drawdown (Since Inception) |
| -1.870M | 1.38% |
Basic Info
| Investment Strategy | |
| The Fund seeks investment results that correspond to 125% of the inverse of the daily price movement of the most recently issued 30-year U.S. Treasury Bond. |
| General | |
| Security Type | Mutual Fund |
| Equity Style | -- |
| Broad Asset Class | Taxable Bond |
| Broad Category | Fixed Income |
| Global Peer Group | Bond Other |
| Peer Group | Specialty Fixed Income Funds |
| Global Macro | Bond Other |
| US Macro | General Domestic Taxable Fixed Income Funds |
| YCharts Categorization | -- |
| YCharts Benchmark | -- |
| Prospectus Objective | Specialty Fixed Income Funds |
| Fund Owner Firm Name | ProFunds |
| Broad Asset Class Benchmark Index | |
| ^BBUSATR | 100.0% |
Net Fund Flows Versus Peer Group
1 Month
% Rank:
78
-109.84M
Peer Group Low
174.25M
Peer Group High
1 Year
% Rank:
63
-1.870M
-2.429B
Peer Group Low
945.32M
Peer Group High
3 Months
% Rank:
52
-194.22M
Peer Group Low
325.65M
Peer Group High
3 Years
% Rank:
63
-466.02M
Peer Group Low
2.656B
Peer Group High
6 Months
% Rank:
41
-1.305B
Peer Group Low
517.86M
Peer Group High
5 Years
% Rank:
74
-1.780B
Peer Group Low
4.893B
Peer Group High
YTD
% Rank:
55
-1.153B
Peer Group Low
449.84M
Peer Group High
10 Years
% Rank:
67
-4.368B
Peer Group Low
5.025B
Peer Group High
Date Unavailable
Risk
Performance Versus Peer Group
Annual Total Returns Versus Peers
As of June 09, 2026.
Asset Allocation
As of January 31, 2026.
| Type | % Net |
|---|---|
| Cash | 98.17% |
| Stock | 0.00% |
| Bond | 0.00% |
| Convertible | 0.00% |
| Preferred | 0.00% |
| Other | 1.83% |
Top 10 Holdings
| Name | % Weight | Price | % Change |
|---|---|---|---|
|
Societe Generale SA/Implied Volatility Surfaces ICE COT 30 Delta TRS
|
66.72% | -- | -- |
|
Societe Generale SA Repo
|
28.61% | -- | -- |
|
Natwest Markets Plc REPO
|
22.89% | -- | -- |
|
HSBC Securities USA Inc Repo
|
22.00% | -- | -- |
|
UMB Bank NA Repo
|
12.35% | -- | -- |
|
Royal Bank of Canada Repo
|
12.30% | -- | -- |
|
Citigroup Inc TRS
|
0.57% | -- | -- |
|
Other Assets less Liabilities
|
0.39% | -- | -- |
|
USD Cash
|
0.02% | -- | -- |
|
Societe Generale Sa TRS
|
-65.85% | -- | -- |
Fees & Availability
| Fees | |
| Actual 12B-1 Fee | -- |
| Actual Management Fee | 0.61% |
| Administration Fee | 50.07K% |
| Maximum Front Load | -- |
| Maximum Deferred Load | -- |
| Maximum Redemption Fee | -- |
| General Availability | |
| Available for Insurance Product | No |
| Available for RRSP | No |
| Purchase Details | |
| Open to New Investors |
|
| Minimum Initial Investment | 15000.00 None |
| Minimum Subsequent Investment | 100.00 None |
Basic Info
| Investment Strategy | |
| The Fund seeks investment results that correspond to 125% of the inverse of the daily price movement of the most recently issued 30-year U.S. Treasury Bond. |
| General | |
| Security Type | Mutual Fund |
| Equity Style | -- |
| Broad Asset Class | Taxable Bond |
| Broad Category | Fixed Income |
| Global Peer Group | Bond Other |
| Peer Group | Specialty Fixed Income Funds |
| Global Macro | Bond Other |
| US Macro | General Domestic Taxable Fixed Income Funds |
| YCharts Categorization | -- |
| YCharts Benchmark | -- |
| Prospectus Objective | Specialty Fixed Income Funds |
| Fund Owner Firm Name | ProFunds |
| Broad Asset Class Benchmark Index | |
| ^BBUSATR | 100.0% |
Fundamentals
| General | |
| Distribution Yield | -- |
| Dividend Yield TTM (6-5-26) | 3.37% |
| 30-Day SEC Yield | -- |
| 7-Day SEC Yield | -- |
| Number of Holdings | 10 |
Fund Details
| Key Dates | |
| Inception Date | 5/1/2002 |
| Last Annual Report Date | 7/31/2025 |
| Last Prospectus Date | 11/28/2025 |
| Share Classes | |
| RRPSX | Service |
| Attributes | |
| Index Fund | -- |
| Inverse Fund |
|
| Leveraged Fund |
|
| Fund of Funds | No |
| Currency Hedged Fund | -- |
| Socially Responsible Fund | No |
Top Portfolio Holders
| Name | % Weight |
|---|---|
| Portfolio A | 5.00% |
| Portfolio B | 3.50% |
| Portfolio C | 2.25% |
Excel Add-In Codes
| Name: =YCI("M:RRPIX", "name") |
| Broad Asset Class: =YCI("M:RRPIX", "broad_asset_class") |
| Broad Category: =YCI("M:RRPIX", "broad_category_group") |
| Prospectus Objective: =YCI("M:RRPIX", "prospectus_objective") |
| To find the codes for any of our securities and financial metrics, see our Complete Excel Reference. |