

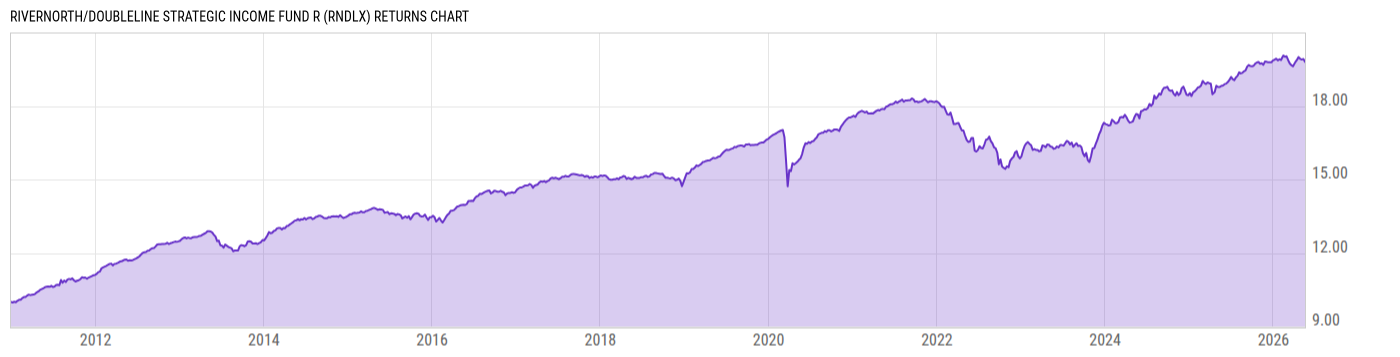
RiverNorth/DoubleLine Strategic Income Fund R (RNDLX)
8.65
-0.01
(-0.12%)
USD |
Jun 08 2026
Returns Chart
Key Stats
| Net Expense Ratio | Total Assets Under Management | Weighted Average Dividend Yield | Turnover Ratio (Generic) |
|---|---|---|---|
| 1.44% | 886.21M | -- | 50.00% |
| 1 Year Fund Level Flows | 1 Year Total Returns (Daily) | Annualized Total Returns Since Inception (Daily) | Max Drawdown (Since Inception) |
| -298.32M | 5.25% |
Basic Info
| Investment Strategy | |
| The Fund seeks for current income and overall total return. The Adviser, after consultation with the Funds sub-adviser, DoubleLine Capital LP, allocates the Fund's assets among three principal strategies: Tactical Closed-end Fund Income strategy, Core Fixed Income strategy, and Opportunistic Income strategy. |
| General | |
| Security Type | Mutual Fund |
| Equity Style | -- |
| Broad Asset Class | Taxable Bond |
| Broad Category | Fixed Income |
| Global Peer Group | Bond USD |
| Peer Group | Multi-Sector Income Funds |
| Global Macro | Bond HC |
| US Macro | General Domestic Taxable Fixed Income Funds |
| YCharts Categorization | -- |
| YCharts Benchmark | -- |
| Prospectus Objective | Multi-Sector Income Funds |
| Fund Owner Firm Name | RiverNorth |
| Broad Asset Class Benchmark Index | |
| ^BBUSATR | 100.0% |
Net Fund Flows Versus Peer Group
1 Month
% Rank:
95
-144.76M
Peer Group Low
572.86M
Peer Group High
1 Year
% Rank:
95
-298.32M
-1.545B
Peer Group Low
30.94B
Peer Group High
3 Months
% Rank:
96
-480.71M
Peer Group Low
1.683B
Peer Group High
3 Years
% Rank:
87
-4.573B
Peer Group Low
71.08B
Peer Group High
6 Months
% Rank:
97
-777.58M
Peer Group Low
12.53B
Peer Group High
5 Years
% Rank:
87
-7.509B
Peer Group Low
61.00B
Peer Group High
YTD
% Rank:
97
-627.92M
Peer Group Low
8.773B
Peer Group High
10 Years
% Rank:
90
-13.91B
Peer Group Low
116.77B
Peer Group High
Date Unavailable
Risk
Performance Versus Peer Group
Annual Total Returns Versus Peers
As of June 09, 2026.
Asset Allocation
As of December 31, 2025.
| Type | % Net |
|---|---|
| Cash | -1.77% |
| Stock | 2.54% |
| Bond | 97.83% |
| Convertible | 0.01% |
| Preferred | 0.59% |
| Other | 0.80% |
Top 10 Holdings
| Name | % Weight | Price | % Change |
|---|---|---|---|
| State Street Institutional Treasury MM Fund Prem | 5.08% | 1.00 | 0.00% |
| RiverNorth/Oaktree High Income Fund I | 3.45% | 8.56 | 0.12% |
| United States of America USGB 3.875 08/15/2034 FIX USD Government | 1.61% | 95.80 | -0.12% |
| United States of America USGB 0.875 11/15/2030 FIX USD Government | 1.57% | 86.37 | -0.02% |
| PIMCO Dynamic Income Fund | 1.40% | 16.68 | -0.12% |
|
GOVERNMENT NATIONAL MORTGAGE ASSOCIATION 22174A AZ SEQ FIX 3.5% 20-MAY-2051
|
1.36% | -- | -- |
|
GOVERNMENT NATIONAL MORTGAGE ASSOCIATION 22174B CZ SEQ FIX 3% 20-DEC-2051
|
1.13% | -- | -- |
| First Trust High Yield Opportunities 2027 Term Fund | 1.08% | 13.34 | 0.11% |
| BlackRock TCP Capital Corp. BLACTCP 6.95 05/30/2029 FIX USD Corporate | 1.01% | 99.29 | 0.34% |
| PGIM Short Duration High Yield Opportunities Fund | 1.00% | 16.08 | 0.19% |
Fees & Availability
| Fees | |
| Actual 12B-1 Fee | 0.25% |
| Actual Management Fee | 0.73% |
| Administration Fee | 42.31K% |
| Maximum Front Load | -- |
| Maximum Deferred Load | -- |
| Maximum Redemption Fee | 0.00% |
| General Availability | |
| Available for Insurance Product | No |
| Available for RRSP | No |
| Purchase Details | |
| Open to New Investors |
|
| Minimum Initial Investment | 5000.00 None |
| Minimum Subsequent Investment | 100.00 None |
Basic Info
| Investment Strategy | |
| The Fund seeks for current income and overall total return. The Adviser, after consultation with the Funds sub-adviser, DoubleLine Capital LP, allocates the Fund's assets among three principal strategies: Tactical Closed-end Fund Income strategy, Core Fixed Income strategy, and Opportunistic Income strategy. |
| General | |
| Security Type | Mutual Fund |
| Equity Style | -- |
| Broad Asset Class | Taxable Bond |
| Broad Category | Fixed Income |
| Global Peer Group | Bond USD |
| Peer Group | Multi-Sector Income Funds |
| Global Macro | Bond HC |
| US Macro | General Domestic Taxable Fixed Income Funds |
| YCharts Categorization | -- |
| YCharts Benchmark | -- |
| Prospectus Objective | Multi-Sector Income Funds |
| Fund Owner Firm Name | RiverNorth |
| Broad Asset Class Benchmark Index | |
| ^BBUSATR | 100.0% |
Fundamentals
| General | |
| Distribution Yield | -- |
| Dividend Yield TTM (6-5-26) | 6.41% |
| 30-Day SEC Yield (5-29-26) | 4.69% |
| 7-Day SEC Yield | -- |
| Number of Holdings | 1315 |
| Bond | |
| Yield to Maturity (12-31-25) | 5.46% |
| Effective Duration | -- |
| Average Coupon | 5.04% |
| Calculated Average Quality | 3.955 |
| Effective Maturity | 15.27 |
| Nominal Maturity | 15.42 |
| Number of Bond Holdings | 1260 |
As of December 31, 2025
Fund Details
| Key Dates | |
| Inception Date | 12/30/2010 |
| Last Annual Report Date | 9/30/2025 |
| Last Prospectus Date | 1/28/2026 |
| Share Classes | |
| RNSIX | Inst |
| Attributes | |
| Index Fund | -- |
| Inverse Fund | No |
| Leveraged Fund | -- |
| Fund of Funds | No |
| Currency Hedged Fund | -- |
| Socially Responsible Fund | No |
Top Portfolio Holders
| Name | % Weight |
|---|---|
| Portfolio A | 5.00% |
| Portfolio B | 3.50% |
| Portfolio C | 2.25% |
Excel Add-In Codes
| Name: =YCI("M:RNDLX", "name") |
| Broad Asset Class: =YCI("M:RNDLX", "broad_asset_class") |
| Broad Category: =YCI("M:RNDLX", "broad_category_group") |
| Prospectus Objective: =YCI("M:RNDLX", "prospectus_objective") |
| To find the codes for any of our securities and financial metrics, see our Complete Excel Reference. |