

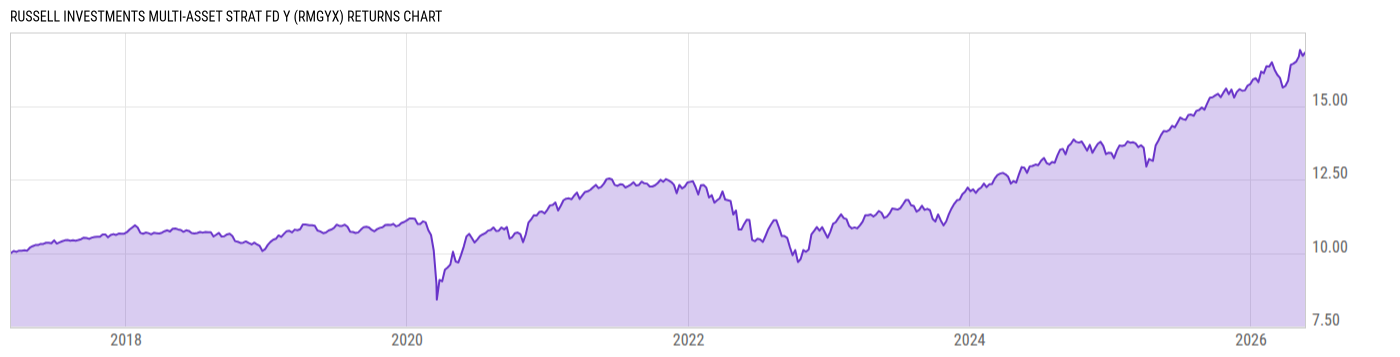
Russell Investments Multi-Asset Strat Fd Y (RMGYX)
12.61
+0.06
(+0.48%)
USD |
Jun 09 2026
Returns Chart
Key Stats
| Net Expense Ratio | Total Assets Under Management | Weighted Average Dividend Yield | Turnover Ratio (Generic) |
|---|---|---|---|
| 0.70% | 602.81M | 1.79% | 101.0% |
| 1 Year Fund Level Flows | 1 Year Total Returns (Daily) | Annualized Total Returns Since Inception (Daily) | Max Drawdown (Since Inception) |
| -65.00M | 17.10% |
Basic Info
| Investment Strategy | |
| The Fund seeks to provide long term total return with lower volatility than equity markets. In an effort to provide equity-like total return over a market cycle while mitigating downside risk and volatility relative to equities, the Fund allocates its assets into a broad range of instruments, asset classes and strategies. |
| General | |
| Security Type | Mutual Fund |
| Equity Style | Multi Cap Core |
| Broad Asset Class | Miscellaneous |
| Broad Category | Allocation |
| Global Peer Group | Mixed Asset USD Flexible - Global |
| Peer Group | Global Allocation Funds |
| Global Macro | Mixed Asset HC Flexible |
| US Macro | -- |
| YCharts Categorization | -- |
| YCharts Benchmark | -- |
| Prospectus Objective | -- |
| Fund Owner Firm Name | Russell Investments |
| Broad Asset Class Benchmark Index | |
| ^SPXTR | 100.0% |
Net Fund Flows Versus Peer Group
1 Month
% Rank:
57
-241.94M
Peer Group Low
215.67M
Peer Group High
1 Year
% Rank:
71
-65.00M
-2.020B
Peer Group Low
2.604B
Peer Group High
3 Months
% Rank:
59
-500.74M
Peer Group Low
588.68M
Peer Group High
3 Years
% Rank:
52
-7.472B
Peer Group Low
4.368B
Peer Group High
6 Months
% Rank:
62
-1.280B
Peer Group Low
1.417B
Peer Group High
5 Years
% Rank:
74
-13.61B
Peer Group Low
5.159B
Peer Group High
YTD
% Rank:
61
-722.86M
Peer Group Low
1.186B
Peer Group High
10 Years
% Rank:
23
-46.97B
Peer Group Low
7.803B
Peer Group High
Date Unavailable
Risk
Performance Versus Peer Group
Annual Total Returns Versus Peers
As of June 10, 2026.
Asset Allocation
As of February 28, 2026.
| Type | % Net |
|---|---|
| Cash | 3.57% |
| Stock | 66.80% |
| Bond | 23.80% |
| Convertible | 0.00% |
| Preferred | 0.27% |
| Other | 5.56% |
Top 10 Holdings
| Name | % Weight | Price | % Change |
|---|---|---|---|
|
2YR T-NOTE JUN26
|
15.09% | -- | -- |
|
EMINI S&P MAR26
|
13.55% | -- | -- |
|
5YR T NOTE JUN26
|
12.02% | -- | -- |
|
Russel US Cash Management Fund
|
5.60% | -- | -- |
|
10Y TNotes JUN26
|
3.44% | -- | -- |
|
EUR Forward Contract
|
2.84% | -- | -- |
|
USD Cash
|
2.84% | -- | -- |
|
10YR TB-DAY MAR6
|
2.20% | -- | -- |
|
ULTRA BOND JUN26
|
1.85% | -- | -- |
|
LONG GILT JUN6
|
1.44% | -- | -- |
Fees & Availability
| Fees | |
| Actual 12B-1 Fee | -- |
| Actual Management Fee | 0.54% |
| Administration Fee | 43.38K% |
| Maximum Front Load | -- |
| Maximum Deferred Load | -- |
| Maximum Redemption Fee | -- |
| General Availability | |
| Available for Insurance Product | No |
| Available for RRSP | No |
| Purchase Details | |
| Open to New Investors |
|
| Minimum Initial Investment | 10.00M None |
| Minimum Subsequent Investment | 0.00 None |
Basic Info
| Investment Strategy | |
| The Fund seeks to provide long term total return with lower volatility than equity markets. In an effort to provide equity-like total return over a market cycle while mitigating downside risk and volatility relative to equities, the Fund allocates its assets into a broad range of instruments, asset classes and strategies. |
| General | |
| Security Type | Mutual Fund |
| Equity Style | Multi Cap Core |
| Broad Asset Class | Miscellaneous |
| Broad Category | Allocation |
| Global Peer Group | Mixed Asset USD Flexible - Global |
| Peer Group | Global Allocation Funds |
| Global Macro | Mixed Asset HC Flexible |
| US Macro | -- |
| YCharts Categorization | -- |
| YCharts Benchmark | -- |
| Prospectus Objective | -- |
| Fund Owner Firm Name | Russell Investments |
| Broad Asset Class Benchmark Index | |
| ^SPXTR | 100.0% |
Fundamentals
| General | |
| Distribution Yield | -- |
| Dividend Yield TTM (6-8-26) | 4.18% |
| 30-Day SEC Yield (5-31-26) | 1.98% |
| 7-Day SEC Yield | -- |
| Number of Holdings | 1290 |
| Stock | |
| Weighted Average PE Ratio | 28.70 |
| Weighted Average Price to Sales Ratio | 6.078 |
| Weighted Average Price to Book Ratio | 6.411 |
| Weighted Median ROE | 42.77% |
| Weighted Median ROA | 9.46% |
| ROI (TTM) | 14.87% |
| Return on Investment (TTM) | 14.87% |
| Earning Yield | 0.0460 |
| LT Debt / Shareholders Equity | 0.7966 |
| Number of Equity Holdings | 1007 |
| Bond | |
| Yield to Maturity (2-28-26) | 5.67% |
| Effective Duration | -- |
| Average Coupon | 3.89% |
| Calculated Average Quality | 4.286 |
| Effective Maturity | 10.48 |
| Nominal Maturity | 10.53 |
| Number of Bond Holdings | 190 |
As of February 28, 2026
Growth Metrics
| EPS Growth (1Y) | 23.36% |
| EPS Growth (3Y) | 12.44% |
| EPS Growth (5Y) | 16.03% |
| Sales Growth (1Y) | 11.71% |
| Sales Growth (3Y) | 9.68% |
| Sales Growth (5Y) | 12.39% |
| Sales per Share Growth (1Y) | 11.01% |
| Sales per Share Growth (3Y) | 10.19% |
| Operating Cash Flow - Growth Rate (3Y) | 15.90% |
As of February 28, 2026
Top Portfolio Holders
| Name | % Weight |
|---|---|
| Portfolio A | 5.00% |
| Portfolio B | 3.50% |
| Portfolio C | 2.25% |
Excel Add-In Codes
| Name: =YCI("M:RMGYX", "name") |
| Broad Asset Class: =YCI("M:RMGYX", "broad_asset_class") |
| Broad Category: =YCI("M:RMGYX", "broad_category_group") |
| Prospectus Objective: =YCI("M:RMGYX", "prospectus_objective") |
| To find the codes for any of our securities and financial metrics, see our Complete Excel Reference. |