

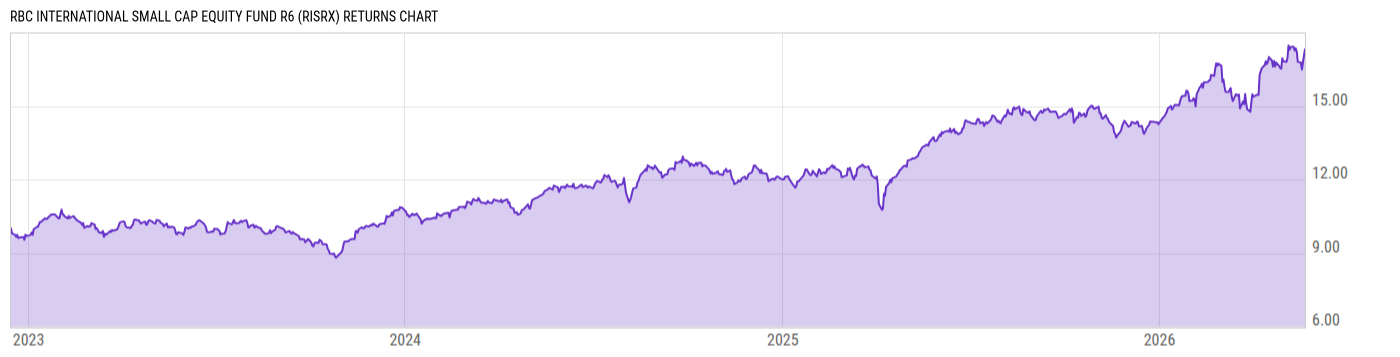
RBC International Small Cap Equity Fund R6 (RISRX)
14.33
-0.08
(-0.56%)
USD |
Jun 09 2026
Returns Chart
Key Stats
| Net Expense Ratio | Total Assets Under Management | Weighted Average Dividend Yield | Turnover Ratio (Generic) |
|---|---|---|---|
| 0.94% | 8.232M | 1.74% | 46.00% |
| 1 Year Fund Level Flows | 1 Year Total Returns (Daily) | Annualized Total Returns Since Inception (Daily) | Max Drawdown (Since Inception) |
| -295.00 | 17.97% |
Basic Info
| Investment Strategy | |
| The Fund seeks to provide long-term capital growth. The Fund seeks to achieve its investment objective by investing, under normal circumstances, at least 80% of its assets in equity securities of small companies located throughout the world, excluding the United States. The Fund will invest in at least three countries. |
| General | |
| Security Type | Mutual Fund |
| Equity Style | Multi Cap Growth |
| Broad Asset Class | International Equity |
| Broad Category | Equity |
| Global Peer Group | Equity Global ex US Sm&Mid Cap |
| Peer Group | International Small/Mid-Cap Growth |
| Global Macro | Equity Global |
| US Macro | Developed International Markets Funds |
| YCharts Categorization | -- |
| YCharts Benchmark | -- |
| Prospectus Objective | International Small-Cap Funds |
| Fund Owner Firm Name | RBC |
| Broad Asset Class Benchmark Index | |
| ^MSACXUSNTR | 100.0% |
Net Fund Flows Versus Peer Group
1 Month
% Rank:
32
-390.68M
Peer Group Low
88.67M
Peer Group High
1 Year
% Rank:
33
-295.00
-1.684B
Peer Group Low
623.20M
Peer Group High
3 Months
% Rank:
23
-669.09M
Peer Group Low
267.69M
Peer Group High
3 Years
% Rank:
25
-3.013B
Peer Group Low
354.39M
Peer Group High
6 Months
% Rank:
30
-831.12M
Peer Group Low
275.92M
Peer Group High
5 Years
% Rank:
13
-5.218B
Peer Group Low
393.52M
Peer Group High
YTD
% Rank:
29
-741.01M
Peer Group Low
272.93M
Peer Group High
10 Years
% Rank:
26
-8.652B
Peer Group Low
938.00M
Peer Group High
Date Unavailable
Risk
Performance Versus Peer Group
Annual Total Returns Versus Peers
As of June 10, 2026.
Asset Allocation
As of March 31, 2026.
| Type | % Net |
|---|---|
| Cash | 1.58% |
| Stock | 97.13% |
| Bond | 1.65% |
| Convertible | 0.00% |
| Preferred | 0.00% |
| Other | -0.36% |
Top 10 Holdings
| Name | % Weight | Price | % Change |
|---|---|---|---|
| RBC BlueBay US Government Money Mkt Fd I1 | 3.23% | 1.00 | 0.00% |
|
CHROMA ATE INC ORD
|
3.13% | -- | -- |
| International Container Terminal Services, Inc. | 2.87% | 14.68 | 0.00% |
| Aker BP ASA | 2.70% | 36.35 | -3.39% |
| Gaztransport & Technigaz SA | 2.67% | 235.18 | 0.00% |
| FOOD & LIFE COMPANIES LTD. | 2.45% | 59.00 | 0.00% |
| Technip Energies NV | 2.37% | 40.15 | 0.00% |
| Kokusai Electric Corp. | 2.37% | 48.98 | 0.00% |
| Fabrinet | 2.35% | 579.67 | -1.08% |
| Beazley Plc | 2.32% | 16.90 | 0.00% |
Fees & Availability
| Fees | |
| Actual 12B-1 Fee | -- |
| Actual Management Fee | -- |
| Administration Fee | -- |
| Maximum Front Load | -- |
| Maximum Deferred Load | -- |
| Maximum Redemption Fee | -- |
| General Availability | |
| Available for Insurance Product | No |
| Available for RRSP | No |
| Purchase Details | |
| Open to New Investors |
|
| Minimum Initial Investment | 250000.0 None |
| Minimum Subsequent Investment | 0.00 None |
Basic Info
| Investment Strategy | |
| The Fund seeks to provide long-term capital growth. The Fund seeks to achieve its investment objective by investing, under normal circumstances, at least 80% of its assets in equity securities of small companies located throughout the world, excluding the United States. The Fund will invest in at least three countries. |
| General | |
| Security Type | Mutual Fund |
| Equity Style | Multi Cap Growth |
| Broad Asset Class | International Equity |
| Broad Category | Equity |
| Global Peer Group | Equity Global ex US Sm&Mid Cap |
| Peer Group | International Small/Mid-Cap Growth |
| Global Macro | Equity Global |
| US Macro | Developed International Markets Funds |
| YCharts Categorization | -- |
| YCharts Benchmark | -- |
| Prospectus Objective | International Small-Cap Funds |
| Fund Owner Firm Name | RBC |
| Broad Asset Class Benchmark Index | |
| ^MSACXUSNTR | 100.0% |
Fundamentals
| General | |
| Distribution Yield | -- |
| Dividend Yield TTM (6-8-26) | 1.98% |
| 30-Day SEC Yield | -- |
| 7-Day SEC Yield | -- |
| Number of Holdings | 10 |
| Stock | |
| Weighted Average PE Ratio | 32.27 |
| Weighted Average Price to Sales Ratio | 6.203 |
| Weighted Average Price to Book Ratio | 6.192 |
| Weighted Median ROE | 21.12% |
| Weighted Median ROA | 9.86% |
| ROI (TTM) | 14.96% |
| Return on Investment (TTM) | 14.96% |
| Earning Yield | 0.0452 |
| LT Debt / Shareholders Equity | 0.5639 |
| Number of Equity Holdings | 9 |
As of March 31, 2026
Growth Metrics
| EPS Growth (1Y) | 26.18% |
| EPS Growth (3Y) | 20.81% |
| EPS Growth (5Y) | 24.67% |
| Sales Growth (1Y) | 15.56% |
| Sales Growth (3Y) | 12.74% |
| Sales Growth (5Y) | 14.88% |
| Sales per Share Growth (1Y) | 51.69% |
| Sales per Share Growth (3Y) | 14.32% |
| Operating Cash Flow - Growth Rate (3Y) | 18.38% |
As of March 31, 2026
Fund Details
Top Portfolio Holders
| Name | % Weight |
|---|---|
| Portfolio A | 5.00% |
| Portfolio B | 3.50% |
| Portfolio C | 2.25% |
Excel Add-In Codes
| Name: =YCI("M:RISRX", "name") |
| Broad Asset Class: =YCI("M:RISRX", "broad_asset_class") |
| Broad Category: =YCI("M:RISRX", "broad_category_group") |
| Prospectus Objective: =YCI("M:RISRX", "prospectus_objective") |
| To find the codes for any of our securities and financial metrics, see our Complete Excel Reference. |