

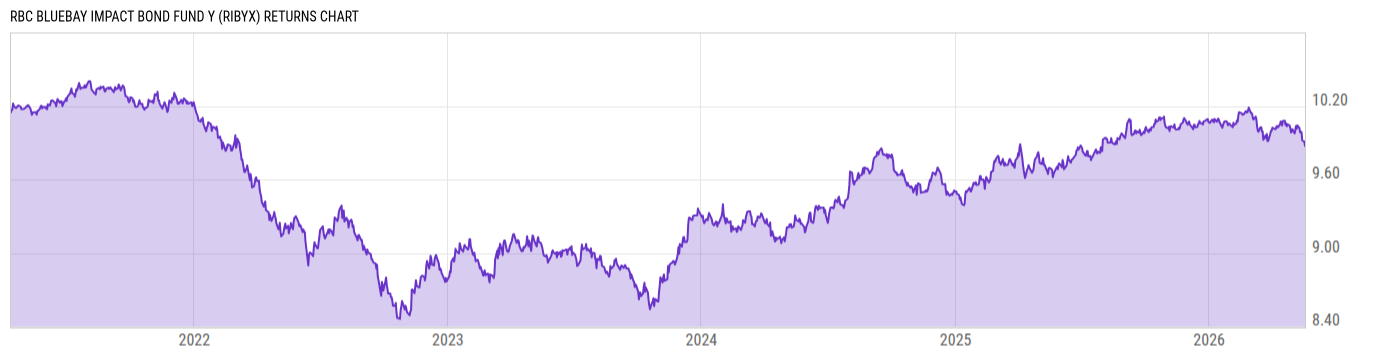
RBC BlueBay Impact Bond Fund Y (RIBYX)
8.43
+0.02
(+0.24%)
USD |
Jun 09 2026
Returns Chart
Key Stats
| Net Expense Ratio | Total Assets Under Management | Weighted Average Dividend Yield | Turnover Ratio (Generic) |
|---|---|---|---|
| 0.40% | 203.91M | -- | 63.00% |
| 1 Year Fund Level Flows | 1 Year Total Returns (Daily) | Annualized Total Returns Since Inception (Daily) | Max Drawdown (Since Inception) |
| -85.47M | 2.91% |
Basic Info
| Investment Strategy | |
| The Fund seeks to achieve a high level of current income consistent with preservation of capital. It invest at least 80% of its assets in fixed income securities meeting the Funds impact criteria, as determined by the Advisors impact methodology. It will primatrily invest in investment grade fixed income securities. |
| General | |
| Security Type | Mutual Fund |
| Equity Style | -- |
| Broad Asset Class | Taxable Bond |
| Broad Category | Fixed Income |
| Global Peer Group | Bond USD |
| Peer Group | General Bond Funds |
| Global Macro | Bond HC |
| US Macro | General Domestic Taxable Fixed Income Funds |
| YCharts Categorization | -- |
| YCharts Benchmark | -- |
| Prospectus Objective | General Bond Funds |
| Fund Owner Firm Name | RBC |
| Broad Asset Class Benchmark Index | |
| ^BBUSATR | 100.0% |
Net Fund Flows Versus Peer Group
1 Month
% Rank:
87
-3.511B
Peer Group Low
3.098B
Peer Group High
1 Year
% Rank:
93
-85.47M
-647.01M
Peer Group Low
13.23B
Peer Group High
3 Months
% Rank:
86
-2.241B
Peer Group Low
3.962B
Peer Group High
3 Years
% Rank:
79
-12.70B
Peer Group Low
18.00B
Peer Group High
6 Months
% Rank:
89
-3.515B
Peer Group Low
5.649B
Peer Group High
5 Years
% Rank:
52
-1.461B
Peer Group Low
49.86B
Peer Group High
YTD
% Rank:
90
-2.086B
Peer Group Low
5.100B
Peer Group High
10 Years
% Rank:
44
-1.866B
Peer Group Low
81.23B
Peer Group High
Date Unavailable
Risk
Performance Versus Peer Group
Annual Total Returns Versus Peers
As of June 10, 2026.
Asset Allocation
As of April 30, 2026.
| Type | % Net |
|---|---|
| Cash | 1.44% |
| Stock | 0.00% |
| Bond | 98.01% |
| Convertible | 0.00% |
| Preferred | 0.00% |
| Other | 0.55% |
Top 10 Holdings
| Name | % Weight | Price | % Change |
|---|---|---|---|
|
FEDERAL NATIONAL MORTGAGE ASSOCIATION 01-AUG-2055 CC0947
|
2.25% | -- | -- |
| RBC BlueBay US Government Money Mkt Fd I1 | 1.88% | 1.00 | 0.00% |
| Amgen Inc. AMGN 5.25 03/02/2033 FIX USD Corporate | 1.70% | 101.58 | 0.20% |
| New York State Electric & Gas Corporation EAS-NYStateE+G 5.05 08/15/2035 FIX USD Corporate 144A | 1.59% | 98.09 | 0.23% |
| Elevance Health, Inc. ELEVHEA 5.15 06/15/2029 FIX USD Corporate | 1.49% | 101.29 | 0.10% |
| American Water Capital Corp. AWCC 4.45 06/01/2032 FIX USD Corporate | 1.47% | 97.70 | 0.17% |
|
FEDERAL NATIONAL MORTGAGE ASSOCIATION 01-JUN-2031 BZ0636
|
1.46% | -- | -- |
| AT&T Inc. ATTINC 5.55 11/01/2045 FIX USD Corporate | 1.37% | 94.18 | 0.57% |
|
LUMINACE ABS ISSUER LLC 2022 B FIX 5.91% 31-JUL-2062
|
1.36% | -- | -- |
|
FEDERAL NATIONAL MORTGAGE ASSOCIATION 01-APR-2030 BZ3608
|
1.34% | -- | -- |
Fees & Availability
| Fees | |
| Actual 12B-1 Fee | -- |
| Actual Management Fee | 0.28% |
| Administration Fee | -- |
| Maximum Front Load | -- |
| Maximum Deferred Load | -- |
| Maximum Redemption Fee | -- |
| General Availability | |
| Available for Insurance Product | No |
| Available for RRSP | No |
| Purchase Details | |
| Open to New Investors |
|
| Minimum Initial Investment | 5.00M None |
| Minimum Subsequent Investment | 0.00 None |
Basic Info
| Investment Strategy | |
| The Fund seeks to achieve a high level of current income consistent with preservation of capital. It invest at least 80% of its assets in fixed income securities meeting the Funds impact criteria, as determined by the Advisors impact methodology. It will primatrily invest in investment grade fixed income securities. |
| General | |
| Security Type | Mutual Fund |
| Equity Style | -- |
| Broad Asset Class | Taxable Bond |
| Broad Category | Fixed Income |
| Global Peer Group | Bond USD |
| Peer Group | General Bond Funds |
| Global Macro | Bond HC |
| US Macro | General Domestic Taxable Fixed Income Funds |
| YCharts Categorization | -- |
| YCharts Benchmark | -- |
| Prospectus Objective | General Bond Funds |
| Fund Owner Firm Name | RBC |
| Broad Asset Class Benchmark Index | |
| ^BBUSATR | 100.0% |
Fundamentals
| General | |
| Distribution Yield | -- |
| Dividend Yield TTM (6-8-26) | 3.98% |
| 30-Day SEC Yield (5-31-26) | 3.87% |
| 7-Day SEC Yield | -- |
| Number of Holdings | 10 |
| Bond | |
| Yield to Maturity (4-30-26) | 4.77% |
| Effective Duration | 5.85 |
| Average Coupon | 4.25% |
| Calculated Average Quality | 2.837 |
| Effective Maturity | 12.15 |
| Nominal Maturity | 12.16 |
| Number of Bond Holdings | 9 |
As of April 30, 2026
Fund Details
Top Portfolio Holders
| Name | % Weight |
|---|---|
| Portfolio A | 5.00% |
| Portfolio B | 3.50% |
| Portfolio C | 2.25% |
Excel Add-In Codes
| Name: =YCI("M:RIBYX", "name") |
| Broad Asset Class: =YCI("M:RIBYX", "broad_asset_class") |
| Broad Category: =YCI("M:RIBYX", "broad_category_group") |
| Prospectus Objective: =YCI("M:RIBYX", "prospectus_objective") |
| To find the codes for any of our securities and financial metrics, see our Complete Excel Reference. |