

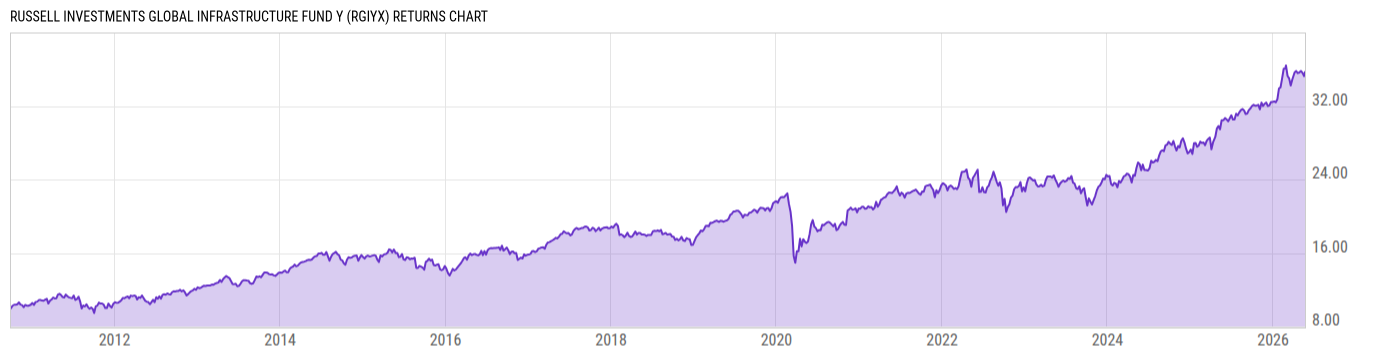
Russell Investments Global Infrastructure Fund Y (RGIYX)
10.93
+0.01
(+0.09%)
USD |
May 22 2026
Returns Chart
Key Stats
| Net Expense Ratio | Total Assets Under Management | Weighted Average Dividend Yield | Turnover Ratio (Generic) |
|---|---|---|---|
| 0.83% | 605.56M | 3.00% | 71.00% |
| 1 Year Fund Level Flows | 1 Year Total Returns (Daily) | Annualized Total Returns Since Inception (Daily) | Max Drawdown (Since Inception) |
| 174.18M | 18.68% |
Basic Info
| Investment Strategy | |
| The Fund seeks to provide long term growth of capital and current income. The Fund primarily invests in equity securities, including common stocks and preferred stocks, of infrastructure companies located in a number of countries around the world, including the U.S., in a globally diversified manner. |
| General | |
| Security Type | Mutual Fund |
| Equity Style | Multi Cap Value |
| Broad Asset Class | Sector Equity |
| Broad Category | Equity |
| Global Peer Group | Equity Theme - Infrastructure |
| Peer Group | Global Infrastructure Funds |
| Global Macro | Equity Theme |
| US Macro | World Sector Equity Funds |
| YCharts Categorization | -- |
| YCharts Benchmark | -- |
| Prospectus Objective | Global Infrastructure Funds |
| Fund Owner Firm Name | Russell Investments |
| Broad Asset Class Benchmark Index | |
| ^MSWNTR | 100.0% |
Net Fund Flows Versus Peer Group
1 Month
% Rank:
58
-13.20M
Peer Group Low
1.045B
Peer Group High
1 Year
% Rank:
22
174.18M
-162.15M
Peer Group Low
5.649B
Peer Group High
3 Months
% Rank:
94
-61.36M
Peer Group Low
2.471B
Peer Group High
3 Years
% Rank:
7
-696.47M
Peer Group Low
6.835B
Peer Group High
6 Months
% Rank:
16
-219.87M
Peer Group Low
3.826B
Peer Group High
5 Years
% Rank:
13
-1.014B
Peer Group Low
7.168B
Peer Group High
YTD
% Rank:
16
-112.58M
Peer Group Low
3.157B
Peer Group High
10 Years
% Rank:
93
-3.832B
Peer Group Low
7.476B
Peer Group High
Date Unavailable
Risk
Performance Versus Peer Group
Annual Total Returns Versus Peers
As of May 24, 2026.
Asset Allocation
As of February 28, 2026.
| Type | % Net |
|---|---|
| Cash | 0.45% |
| Stock | 95.96% |
| Bond | 0.00% |
| Convertible | 0.00% |
| Preferred | 0.00% |
| Other | 3.60% |
Top 10 Holdings
| Name | % Weight | Price | % Change |
|---|---|---|---|
| Transurban Group Ltd. | 4.21% | 10.90 | 8.46% |
| NextEra Energy, Inc. | 4.14% | 88.55 | -1.27% |
| Aena S.M.E. SA | 4.07% | 27.27 | -1.63% |
|
Russell US Cash Management Fund
|
3.36% | -- | -- |
| American Electric Power Co., Inc. | 2.94% | 131.59 | 1.53% |
| Getlink SE | 2.83% | 21.60 | 0.46% |
| Xcel Energy, Inc. | 2.68% | 81.08 | 1.10% |
| Sempra | 2.68% | 92.80 | 1.37% |
| National Grid Plc | 2.62% | 17.47 | 3.80% |
| Entergy Corp. | 2.46% | 112.40 | 0.12% |
Fees & Availability
| Fees | |
| Actual 12B-1 Fee | -- |
| Actual Management Fee | 0.64% |
| Administration Fee | 22.94K% |
| Maximum Front Load | -- |
| Maximum Deferred Load | -- |
| Maximum Redemption Fee | -- |
| General Availability | |
| Available for Insurance Product | No |
| Available for RRSP | No |
| Purchase Details | |
| Open to New Investors |
|
| Minimum Initial Investment | 10.00M None |
| Minimum Subsequent Investment | 0.00 None |
Basic Info
| Investment Strategy | |
| The Fund seeks to provide long term growth of capital and current income. The Fund primarily invests in equity securities, including common stocks and preferred stocks, of infrastructure companies located in a number of countries around the world, including the U.S., in a globally diversified manner. |
| General | |
| Security Type | Mutual Fund |
| Equity Style | Multi Cap Value |
| Broad Asset Class | Sector Equity |
| Broad Category | Equity |
| Global Peer Group | Equity Theme - Infrastructure |
| Peer Group | Global Infrastructure Funds |
| Global Macro | Equity Theme |
| US Macro | World Sector Equity Funds |
| YCharts Categorization | -- |
| YCharts Benchmark | -- |
| Prospectus Objective | Global Infrastructure Funds |
| Fund Owner Firm Name | Russell Investments |
| Broad Asset Class Benchmark Index | |
| ^MSWNTR | 100.0% |
Fundamentals
| General | |
| Distribution Yield | -- |
| Dividend Yield TTM (5-21-26) | 8.64% |
| 30-Day SEC Yield (4-30-26) | 2.03% |
| 7-Day SEC Yield | -- |
| Number of Holdings | 149 |
| Stock | |
| Weighted Average PE Ratio | 27.88 |
| Weighted Average Price to Sales Ratio | 4.722 |
| Weighted Average Price to Book Ratio | 4.220 |
| Weighted Median ROE | 15.77% |
| Weighted Median ROA | 4.94% |
| ROI (TTM) | 5.70% |
| Return on Investment (TTM) | 5.70% |
| Earning Yield | 0.0432 |
| LT Debt / Shareholders Equity | 1.458 |
| Number of Equity Holdings | 124 |
As of February 28, 2026
Growth Metrics
| EPS Growth (1Y) | 11.65% |
| EPS Growth (3Y) | 17.91% |
| EPS Growth (5Y) | 16.28% |
| Sales Growth (1Y) | 9.47% |
| Sales Growth (3Y) | 5.95% |
| Sales Growth (5Y) | 10.35% |
| Sales per Share Growth (1Y) | 8.30% |
| Sales per Share Growth (3Y) | 5.00% |
| Operating Cash Flow - Growth Rate (3Y) | 13.64% |
As of February 28, 2026
Fund Details
Top Portfolio Holders
| Name | % Weight |
|---|---|
| Portfolio A | 5.00% |
| Portfolio B | 3.50% |
| Portfolio C | 2.25% |
Excel Add-In Codes
| Name: =YCI("M:RGIYX", "name") |
| Broad Asset Class: =YCI("M:RGIYX", "broad_asset_class") |
| Broad Category: =YCI("M:RGIYX", "broad_category_group") |
| Prospectus Objective: =YCI("M:RGIYX", "prospectus_objective") |
| To find the codes for any of our securities and financial metrics, see our Complete Excel Reference. |