

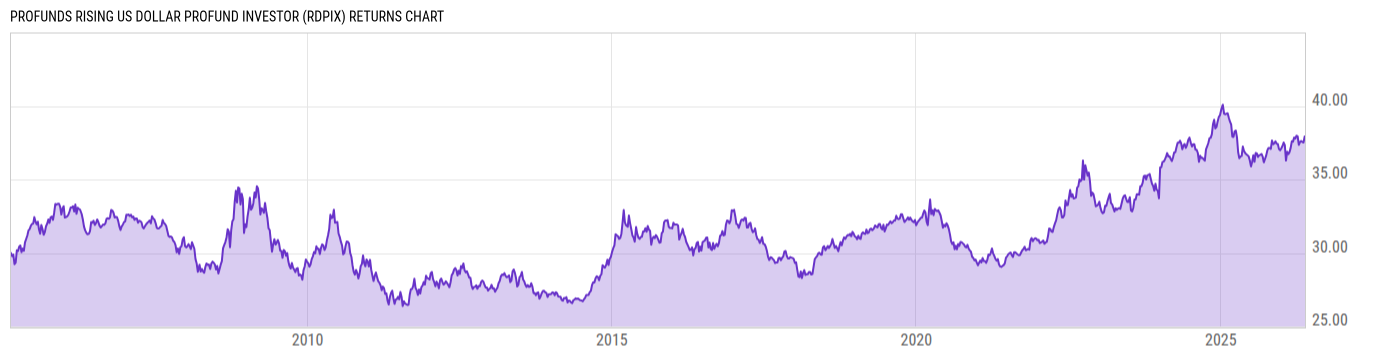
ProFunds Rising US Dollar ProFund Investor (RDPIX)
29.64
-0.02
(-0.07%)
USD |
Jun 09 2026
Returns Chart
Key Stats
| Net Expense Ratio | Total Assets Under Management | Weighted Average Dividend Yield | Turnover Ratio (Generic) |
|---|---|---|---|
| 1.78% | 10.92M | -- | 1.30K% |
| 1 Year Fund Level Flows | 1 Year Total Returns (Daily) | Annualized Total Returns Since Inception (Daily) | Max Drawdown (Since Inception) |
| 1.995M | 4.40% |
Basic Info
| Investment Strategy | |
| The Fund seeks daily investment results, before fees and expenses, that correspond to the daily performance of the U.S. Dollar Index. The Fund takes positions in financial instruments that, in combination, should have similar daily return characteristics as the U.S. Dollar Index. |
| General | |
| Security Type | Mutual Fund |
| Equity Style | -- |
| Broad Asset Class | Taxable Bond |
| Broad Category | Alternative Strategies |
| Global Peer Group | Alternative Cryptocurrency |
| Peer Group | Alternative Currency Strategies Funds |
| Global Macro | Liquid Alternatives |
| US Macro | Alternative Bond Funds |
| YCharts Categorization | -- |
| YCharts Benchmark | -- |
| Prospectus Objective | Alternative Currency Strategies Funds |
| Fund Owner Firm Name | ProFunds |
| Broad Asset Class Benchmark Index | |
| ^BBUSATR | 100.0% |
Net Fund Flows Versus Peer Group
1 Month
% Rank:
79
-27.45M
Peer Group Low
177.27M
Peer Group High
1 Year
% Rank:
61
1.995M
-361.48M
Peer Group Low
1.251B
Peer Group High
3 Months
% Rank:
73
-67.76M
Peer Group Low
517.01M
Peer Group High
3 Years
% Rank:
80
-350.74M
Peer Group Low
1.251B
Peer Group High
6 Months
% Rank:
61
-291.64M
Peer Group Low
1.251B
Peer Group High
5 Years
% Rank:
59
-283.28M
Peer Group Low
1.251B
Peer Group High
YTD
% Rank:
65
-125.28M
Peer Group Low
1.017B
Peer Group High
10 Years
% Rank:
83
-3.236B
Peer Group Low
1.251B
Peer Group High
Date Unavailable
Risk
Performance Versus Peer Group
Annual Total Returns Versus Peers
As of June 10, 2026.
Asset Allocation
As of January 31, 2026.
| Type | % Net |
|---|---|
| Cash | 94.30% |
| Stock | 0.00% |
| Bond | 0.00% |
| Convertible | 0.00% |
| Preferred | 0.00% |
| Other | 5.70% |
Top 10 Holdings
| Name | % Weight | Price | % Change |
|---|---|---|---|
|
Societe Generale SA Repo
|
27.48% | -- | -- |
|
Natwest Markets Plc REPO
|
22.00% | -- | -- |
|
HSBC Securities USA Inc Repo
|
21.15% | -- | -- |
|
UMB Bank NA Repo
|
11.83% | -- | -- |
|
Royal Bank of Canada Repo
|
11.83% | -- | -- |
|
Other Assets less Liabilities
|
7.09% | -- | -- |
|
USD Cash
|
0.01% | -- | -- |
|
CAD Forward Contract
|
0.00% | -- | -- |
|
CHF Forward Contract
|
-0.00% | -- | -- |
|
SEK Forward Contract
|
-0.00% | -- | -- |
Fees & Availability
| Fees | |
| Actual 12B-1 Fee | -- |
| Actual Management Fee | 0.31% |
| Administration Fee | 33.70K% |
| Maximum Front Load | -- |
| Maximum Deferred Load | -- |
| Maximum Redemption Fee | -- |
| General Availability | |
| Available for Insurance Product | No |
| Available for RRSP | No |
| Purchase Details | |
| Open to New Investors |
|
| Minimum Initial Investment | 15000.00 None |
| Minimum Subsequent Investment | 100.00 None |
Basic Info
| Investment Strategy | |
| The Fund seeks daily investment results, before fees and expenses, that correspond to the daily performance of the U.S. Dollar Index. The Fund takes positions in financial instruments that, in combination, should have similar daily return characteristics as the U.S. Dollar Index. |
| General | |
| Security Type | Mutual Fund |
| Equity Style | -- |
| Broad Asset Class | Taxable Bond |
| Broad Category | Alternative Strategies |
| Global Peer Group | Alternative Cryptocurrency |
| Peer Group | Alternative Currency Strategies Funds |
| Global Macro | Liquid Alternatives |
| US Macro | Alternative Bond Funds |
| YCharts Categorization | -- |
| YCharts Benchmark | -- |
| Prospectus Objective | Alternative Currency Strategies Funds |
| Fund Owner Firm Name | ProFunds |
| Broad Asset Class Benchmark Index | |
| ^BBUSATR | 100.0% |
Fundamentals
| General | |
| Distribution Yield | -- |
| Dividend Yield TTM (6-8-26) | 2.12% |
| 30-Day SEC Yield | -- |
| 7-Day SEC Yield | -- |
| Number of Holdings | 14 |
Fund Details
| Key Dates | |
| Inception Date | 2/17/2005 |
| Last Annual Report Date | 7/31/2025 |
| Last Prospectus Date | 11/28/2025 |
| Share Classes | |
| RDPSX | Service |
| Attributes | |
| Index Fund |
|
| Inverse Fund |
|
| Leveraged Fund |
|
| Fund of Funds | No |
| Currency Hedged Fund | -- |
| Socially Responsible Fund | No |
Top Portfolio Holders
| Name | % Weight |
|---|---|
| Portfolio A | 5.00% |
| Portfolio B | 3.50% |
| Portfolio C | 2.25% |
Excel Add-In Codes
| Name: =YCI("M:RDPIX", "name") |
| Broad Asset Class: =YCI("M:RDPIX", "broad_asset_class") |
| Broad Category: =YCI("M:RDPIX", "broad_category_group") |
| Prospectus Objective: =YCI("M:RDPIX", "prospectus_objective") |
| To find the codes for any of our securities and financial metrics, see our Complete Excel Reference. |