

First Trust Private Credit Fund I (FTPCX)
9.79
0.00 (0.00%)
USD |
May 21 2026
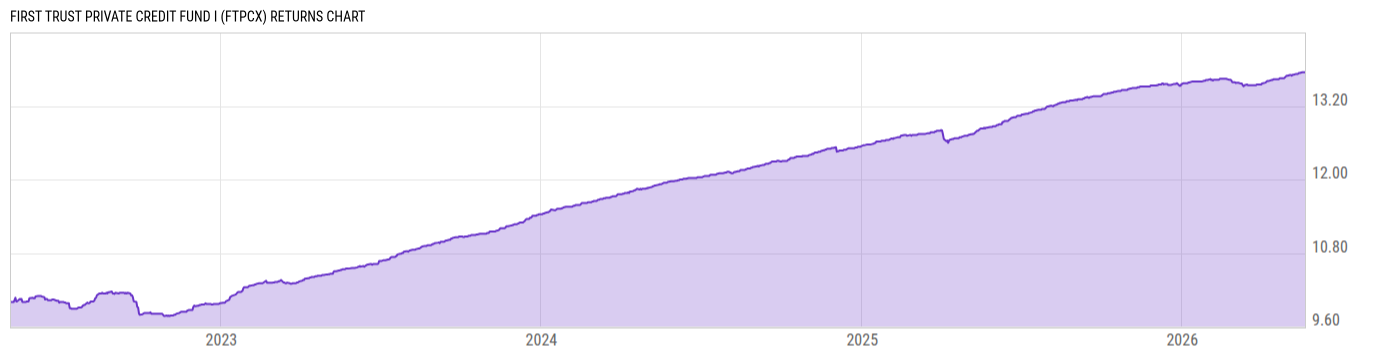
Returns Chart
Key Stats
| Net Expense Ratio | Total Assets Under Management | Weighted Average Dividend Yield | Turnover Ratio (Generic) |
|---|---|---|---|
| 2.33% | 479.49M | -- | 27.00% |
| 1 Year Fund Level Flows | 1 Year Total Returns (Daily) | Annualized Total Returns Since Inception (Daily) | Max Drawdown (Since Inception) |
| -- | 7.17% |
Basic Info
| Investment Strategy | |
| The Fund seeks to produce current income. Under normal circumstances, the Fund seeks to achieve its investment objective by allocating at least 80% of its net assets, plus the amount of any borrowings for investment purposes, across a wide array of credit strategies and diverse portfolio of private credit instruments. |
| General | |
| Security Type | Unlisted Closed-End Fund |
| Equity Style | -- |
| Broad Asset Class | Taxable Bond |
| Broad Category | Fixed Income |
| Global Peer Group | Bond USD |
| Peer Group | General Bond Funds |
| Global Macro | Bond HC |
| US Macro | General Domestic Taxable Fixed Income Funds |
| YCharts Categorization | -- |
| YCharts Benchmark | -- |
| Prospectus Objective | General Bond Funds |
| Fund Owner Firm Name | Vivaldi Asset Management |
| Broad Asset Class Benchmark Index | |
| ^BBUSATR | 100.0% |
Net Fund Flows Versus Peer Group
1 Month
% Rank:
--
-3.511B
Peer Group Low
288.35M
Peer Group High
1 Year
% Rank:
--
-641.24M
Peer Group Low
13.23B
Peer Group High
3 Months
% Rank:
--
-2.235B
Peer Group Low
1.456B
Peer Group High
3 Years
% Rank:
--
-12.70B
Peer Group Low
18.00B
Peer Group High
6 Months
% Rank:
--
-3.509B
Peer Group Low
2.976B
Peer Group High
5 Years
% Rank:
--
-1.455B
Peer Group Low
49.86B
Peer Group High
YTD
% Rank:
--
-2.080B
Peer Group Low
2.002B
Peer Group High
10 Years
% Rank:
--
-1.866B
Peer Group Low
81.23B
Peer Group High
Date Unavailable
Risk
Performance Versus Peer Group
Annual Total Returns Versus Peers
As of May 22, 2026.
Asset Allocation
As of December 31, 2025.
| Type | % Net |
|---|---|
| Cash | -0.29% |
| Stock | 7.67% |
| Bond | 82.33% |
| Convertible | 0.00% |
| Preferred | 0.00% |
| Other | 10.29% |
Top 10 Holdings
| Name | % Weight | Price | % Change |
|---|---|---|---|
|
Audax Private Credit Fund LP
|
3.66% | -- | -- |
|
UMB Money Market II Special Fund
|
2.60% | -- | -- |
|
Pareto Buyer LLC FRN 12-Dec-2032
|
2.02% | -- | -- |
|
Linden Investors LP
|
2.01% | -- | -- |
|
DSC Meridian LP
|
1.96% | -- | -- |
|
Whitehawk Therapeutics Inc FRN 17-Sep-2030
|
1.87% | -- | -- |
|
WhiteHawk Shryne FRN 26-May-2026
|
1.82% | -- | -- |
|
GREGORY SPV S.R.L. 30-DEC-2045
|
1.80% | -- | -- |
|
Acer Tree Credit Opportunities Partners LP
|
1.70% | -- | -- |
|
TCW Direct Lending VIII LLC
|
1.57% | -- | -- |
Fees & Availability
| Fees | |
| Actual 12B-1 Fee | 0.11% |
| Actual Management Fee | 0.99% |
| Administration Fee | 71.52K% |
| Maximum Front Load | -- |
| Maximum Deferred Load | -- |
| Maximum Redemption Fee | -- |
| General Availability | |
| Available for Insurance Product | No |
| Available for RRSP | No |
| Purchase Details | |
| Open to New Investors |
|
| Minimum Initial Investment | 1000.00 None |
| Minimum Subsequent Investment | 1000.00 None |
Basic Info
| Investment Strategy | |
| The Fund seeks to produce current income. Under normal circumstances, the Fund seeks to achieve its investment objective by allocating at least 80% of its net assets, plus the amount of any borrowings for investment purposes, across a wide array of credit strategies and diverse portfolio of private credit instruments. |
| General | |
| Security Type | Unlisted Closed-End Fund |
| Equity Style | -- |
| Broad Asset Class | Taxable Bond |
| Broad Category | Fixed Income |
| Global Peer Group | Bond USD |
| Peer Group | General Bond Funds |
| Global Macro | Bond HC |
| US Macro | General Domestic Taxable Fixed Income Funds |
| YCharts Categorization | -- |
| YCharts Benchmark | -- |
| Prospectus Objective | General Bond Funds |
| Fund Owner Firm Name | Vivaldi Asset Management |
| Broad Asset Class Benchmark Index | |
| ^BBUSATR | 100.0% |
Fundamentals
| General | |
| Distribution Yield | -- |
| Dividend Yield TTM (5-20-26) | 10.29% |
| 30-Day SEC Yield | -- |
| 7-Day SEC Yield | -- |
| Number of Holdings | 270 |
| Stock | |
| Weighted Average PE Ratio | -- |
| Weighted Average Price to Sales Ratio | -- |
| Weighted Average Price to Book Ratio | -- |
| Weighted Median ROE | -- |
| Weighted Median ROA | -- |
| ROI (TTM) | -- |
| Return on Investment (TTM) | -- |
| Earning Yield | -- |
| LT Debt / Shareholders Equity | -- |
| Number of Equity Holdings | 7 |
| Bond | |
| Yield to Maturity (12-31-25) | 6.88% |
| Effective Duration | -- |
| Average Coupon | 8.86% |
| Calculated Average Quality | 3.922 |
| Effective Maturity | 8.317 |
| Nominal Maturity | 8.317 |
| Number of Bond Holdings | 242 |
As of December 31, 2025
Growth Metrics
| EPS Growth (1Y) | -- |
| EPS Growth (3Y) | -- |
| EPS Growth (5Y) | -- |
| Sales Growth (1Y) | -- |
| Sales Growth (3Y) | -- |
| Sales Growth (5Y) | -- |
| Sales per Share Growth (1Y) | -- |
| Sales per Share Growth (3Y) | -- |
| Operating Cash Flow - Growth Rate (3Y) | -- |
As of December 31, 2025
Fund Details
| Key Dates | |
| Launch Date | 5/6/2022 |
| Last Annual Report Date | 3/31/2025 |
| Last Prospectus Date | 7/31/2025 |
| Share Classes | |
| FTCAX | A |
| Attributes | |
| Index Fund | -- |
| Inverse Fund | No |
| Leveraged Fund | -- |
| Fund of Funds | No |
| Currency Hedged Fund | -- |
| Socially Responsible Fund | No |
Top Portfolio Holders
| Name | % Weight |
|---|---|
| Portfolio A | 5.00% |
| Portfolio B | 3.50% |
| Portfolio C | 2.25% |