

Cohen & Steers Real Assets Fund C (RAPCX)
12.23
-0.01
(-0.08%)
USD |
Jun 09 2026
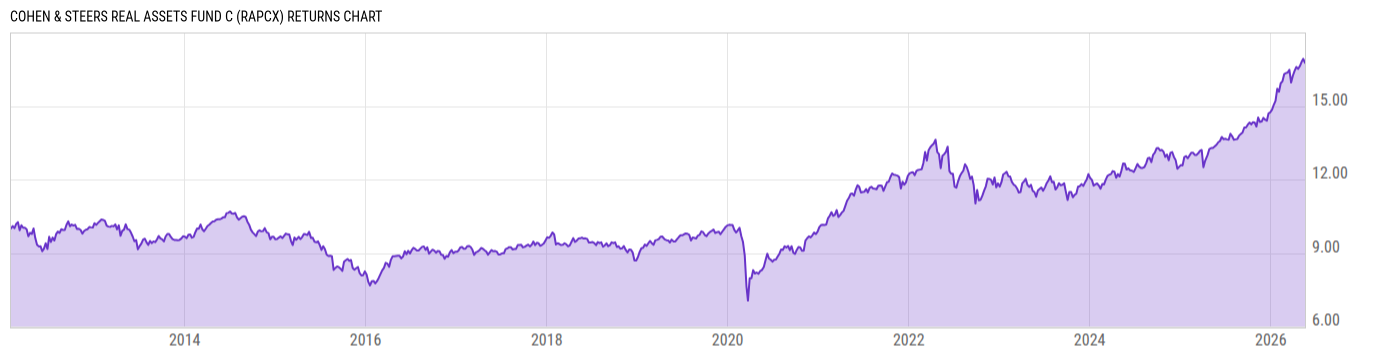
Returns Chart
Key Stats
| Net Expense Ratio | Total Assets Under Management | Weighted Average Dividend Yield | Turnover Ratio (Generic) |
|---|---|---|---|
| 1.81% | 1.965B | 2.88% | 76.00% |
| 1 Year Fund Level Flows | 1 Year Total Returns (Daily) | Annualized Total Returns Since Inception (Daily) | Max Drawdown (Since Inception) |
| 451.13M | 20.14% |
Basic Info
| Investment Strategy | |
| The Fund seeks attractive total returns over the long-term and maximizes real returns during inflationary environments. The Fund invests 80% of its assets in U.S. and non-U.S. investments providing exposure to or investment in commodities, infrastructure, and real estate companies, REITs, gold and other precious metals. |
| General | |
| Security Type | Mutual Fund |
| Equity Style | Multi Cap Value |
| Broad Asset Class | Allocation |
| Broad Category | Allocation |
| Global Peer Group | Mixed Asset USD Flexible - Global |
| Peer Group | Real Return Funds |
| Global Macro | Mixed Asset HC Flexible |
| US Macro | Mixed-Assets Funds |
| YCharts Categorization | -- |
| YCharts Benchmark | -- |
| Prospectus Objective | Real Return Funds |
| Fund Owner Firm Name | Cohen & Steers |
| Broad Asset Class Benchmark Index | |
| ^SPXTR | 100.0% |
Net Fund Flows Versus Peer Group
1 Month
% Rank:
9
-91.91M
Peer Group Low
102.61M
Peer Group High
1 Year
% Rank:
7
451.13M
-3.447B
Peer Group Low
761.88M
Peer Group High
3 Months
% Rank:
8
-767.72M
Peer Group Low
391.06M
Peer Group High
3 Years
% Rank:
6
-2.001B
Peer Group Low
758.22M
Peer Group High
6 Months
% Rank:
7
-2.264B
Peer Group Low
665.69M
Peer Group High
5 Years
% Rank:
4
-2.337B
Peer Group Low
1.294B
Peer Group High
YTD
% Rank:
7
-1.564B
Peer Group Low
653.00M
Peer Group High
10 Years
% Rank:
13
-2.770B
Peer Group Low
3.054B
Peer Group High
Date Unavailable
Risk
Performance Versus Peer Group
Annual Total Returns Versus Peers
As of June 10, 2026.
Asset Allocation
As of March 31, 2026.
| Type | % Net |
|---|---|
| Cash | 0.29% |
| Stock | 59.24% |
| Bond | 16.88% |
| Convertible | 0.00% |
| Preferred | 0.00% |
| Other | 23.59% |
Top 10 Holdings
| Name | % Weight | Price | % Change |
|---|---|---|---|
|
Cohen & Steers Real Assets Fund;I
|
17.67% | -- | -- |
| SPDR Gold MiniShares Trust | 4.07% | 81.25 | -3.57% |
| Welltower, Inc. | 2.92% | 209.69 | 1.41% |
| Digital Realty Trust, Inc. | 1.72% | 182.18 | -1.49% |
| Equinix, Inc. | 1.37% | 1040.00 | -1.87% |
| The Williams Cos., Inc. | 1.35% | 72.67 | 1.51% |
| Prologis, Inc. | 1.30% | 146.33 | -0.81% |
| TC Energy Corp. | 1.16% | 69.16 | 1.45% |
| Exxon Mobil Corp. | 1.16% | 151.05 | 1.44% |
| United States of America USGB 04/30/2026 FLT USD Government (Matured) | 1.12% | 100.00 | -0.01% |
Fees & Availability
| Fees | |
| Actual 12B-1 Fee | 0.75% |
| Actual Management Fee | 0.65% |
| Administration Fee | 3.33K% |
| Maximum Front Load | -- |
| Maximum Deferred Load | 1.00% |
| Maximum Redemption Fee | -- |
| General Availability | |
| Available for Insurance Product | -- |
| Available for RRSP | -- |
| Purchase Details | |
| Open to New Investors |
|
| Minimum Initial Investment | 0.00 None |
| Minimum Subsequent Investment | 0.00 None |
Basic Info
| Investment Strategy | |
| The Fund seeks attractive total returns over the long-term and maximizes real returns during inflationary environments. The Fund invests 80% of its assets in U.S. and non-U.S. investments providing exposure to or investment in commodities, infrastructure, and real estate companies, REITs, gold and other precious metals. |
| General | |
| Security Type | Mutual Fund |
| Equity Style | Multi Cap Value |
| Broad Asset Class | Allocation |
| Broad Category | Allocation |
| Global Peer Group | Mixed Asset USD Flexible - Global |
| Peer Group | Real Return Funds |
| Global Macro | Mixed Asset HC Flexible |
| US Macro | Mixed-Assets Funds |
| YCharts Categorization | -- |
| YCharts Benchmark | -- |
| Prospectus Objective | Real Return Funds |
| Fund Owner Firm Name | Cohen & Steers |
| Broad Asset Class Benchmark Index | |
| ^SPXTR | 100.0% |
Fundamentals
| General | |
| Distribution Yield | -- |
| Dividend Yield TTM (6-8-26) | 4.91% |
| 30-Day SEC Yield (5-31-26) | 0.55% |
| 7-Day SEC Yield | -- |
| Number of Holdings | 329 |
| Stock | |
| Weighted Average PE Ratio | 26.95 |
| Weighted Average Price to Sales Ratio | 6.171 |
| Weighted Average Price to Book Ratio | 3.170 |
| Weighted Median ROE | 11.54% |
| Weighted Median ROA | 4.03% |
| ROI (TTM) | 5.96% |
| Return on Investment (TTM) | 5.96% |
| Earning Yield | 0.0466 |
| LT Debt / Shareholders Equity | 0.9507 |
| Number of Equity Holdings | 201 |
| Bond | |
| Yield to Maturity (3-31-26) | 5.24% |
| Effective Duration | -- |
| Average Coupon | 4.59% |
| Calculated Average Quality | 3.705 |
| Effective Maturity | 3.937 |
| Nominal Maturity | 13.56 |
| Number of Bond Holdings | 97 |
As of March 31, 2026
Growth Metrics
| EPS Growth (1Y) | 18.62% |
| EPS Growth (3Y) | 7.95% |
| EPS Growth (5Y) | 11.35% |
| Sales Growth (1Y) | 9.43% |
| Sales Growth (3Y) | 4.39% |
| Sales Growth (5Y) | 10.40% |
| Sales per Share Growth (1Y) | 6.51% |
| Sales per Share Growth (3Y) | 1.66% |
| Operating Cash Flow - Growth Rate (3Y) | 10.52% |
As of March 31, 2026
Top Portfolio Holders
| Name | % Weight |
|---|---|
| Portfolio A | 5.00% |
| Portfolio B | 3.50% |
| Portfolio C | 2.25% |
Excel Add-In Codes
| Name: =YCI("M:RAPCX", "name") |
| Broad Asset Class: =YCI("M:RAPCX", "broad_asset_class") |
| Broad Category: =YCI("M:RAPCX", "broad_category_group") |
| Prospectus Objective: =YCI("M:RAPCX", "prospectus_objective") |
| To find the codes for any of our securities and financial metrics, see our Complete Excel Reference. |