

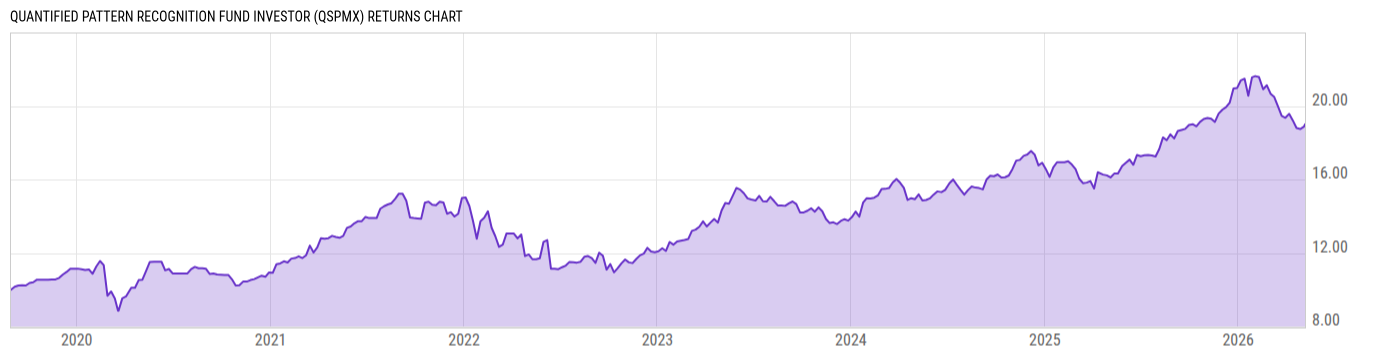
Quantified Pattern Recognition Fund Investor (QSPMX)
13.45
-0.02
(-0.15%)
USD |
May 29 2026
Returns Chart
Key Stats
| Net Expense Ratio | Total Assets Under Management | Weighted Average Dividend Yield | Turnover Ratio (Generic) |
|---|---|---|---|
| 1.79% | 48.80M | -- | 889.0% |
| 1 Year Fund Level Flows | 1 Year Total Returns (Daily) | Annualized Total Returns Since Inception (Daily) | Max Drawdown (Since Inception) |
| 9.237M | 14.98% |
Basic Info
| Investment Strategy | |
| The Fund seeks capital appreciation. The Fund primarily invests in equity index mutual funds, unaffiliated equity index exchange traded funds (ETFs), future contracts equity index swaps and cash equivalents. The Fund invests in ETFs and mutual funds that are not affiliated with the Adviser or Subadviser. |
| General | |
| Security Type | Mutual Fund |
| Equity Style | -- |
| Broad Asset Class | US Equity |
| Broad Category | Equity |
| Global Peer Group | Equity Other |
| Peer Group | Specialty Diversified Equity Funds |
| Global Macro | Equity Other |
| US Macro | Large-Cap Funds |
| YCharts Categorization | -- |
| YCharts Benchmark | -- |
| Prospectus Objective | Growth Funds |
| Fund Owner Firm Name | Advisors Preferred |
| Broad Asset Class Benchmark Index | |
| ^SPXTR | 100.0% |
Net Fund Flows Versus Peer Group
1 Month
% Rank:
64
-24.02M
Peer Group Low
-23116.00
Peer Group High
1 Year
% Rank:
10
9.237M
-146.46M
Peer Group Low
9.237M
Peer Group High
3 Months
% Rank:
73
-42.59M
Peer Group Low
-593924.0
Peer Group High
3 Years
% Rank:
19
-517.12M
Peer Group Low
17.07M
Peer Group High
6 Months
% Rank:
10
-72.56M
Peer Group Low
5.112M
Peer Group High
5 Years
% Rank:
37
-752.72M
Peer Group Low
17.07M
Peer Group High
YTD
% Rank:
28
-51.85M
Peer Group Low
-500080.0
Peer Group High
10 Years
% Rank:
19
-1.692B
Peer Group Low
70.36M
Peer Group High
Date Unavailable
Risk
Performance Versus Peer Group
Annual Total Returns Versus Peers
As of May 29, 2026.
Asset Allocation
As of December 31, 2025.
| Type | % Net |
|---|---|
| Cash | 45.40% |
| Stock | 0.24% |
| Bond | 46.90% |
| Convertible | 0.00% |
| Preferred | 0.00% |
| Other | 7.47% |
Top 8 Holdings
| Name | % Weight | Price | % Change |
|---|---|---|---|
| First American Government Obligations Fd Z | 45.63% | 1.00 | 0.00% |
| Fidelity Instl Government Portfolio I | 45.63% | 1.00 | 0.00% |
|
Hyperion Fund LLC
|
5.58% | -- | -- |
|
StoneCastle
|
1.88% | -- | -- |
|
USD Cash
|
0.69% | -- | -- |
|
Other Assets less Liabilities
|
0.35% | -- | -- |
| State Street SPDR S&P 500 ETF Trust | 0.24% | 756.61 | 0.27% |
|
EMINI S&P MAR26
|
0.00% | -- | -- |
Fees & Availability
| Fees | |
| Actual 12B-1 Fee | 0.25% |
| Actual Management Fee | 1.00% |
| Administration Fee | 77.13K% |
| Maximum Front Load | -- |
| Maximum Deferred Load | -- |
| Maximum Redemption Fee | -- |
| General Availability | |
| Available for Insurance Product | No |
| Available for RRSP | No |
| Purchase Details | |
| Open to New Investors |
|
| Minimum Initial Investment | 10000.00 None |
| Minimum Subsequent Investment | 1000.00 None |
Basic Info
| Investment Strategy | |
| The Fund seeks capital appreciation. The Fund primarily invests in equity index mutual funds, unaffiliated equity index exchange traded funds (ETFs), future contracts equity index swaps and cash equivalents. The Fund invests in ETFs and mutual funds that are not affiliated with the Adviser or Subadviser. |
| General | |
| Security Type | Mutual Fund |
| Equity Style | -- |
| Broad Asset Class | US Equity |
| Broad Category | Equity |
| Global Peer Group | Equity Other |
| Peer Group | Specialty Diversified Equity Funds |
| Global Macro | Equity Other |
| US Macro | Large-Cap Funds |
| YCharts Categorization | -- |
| YCharts Benchmark | -- |
| Prospectus Objective | Growth Funds |
| Fund Owner Firm Name | Advisors Preferred |
| Broad Asset Class Benchmark Index | |
| ^SPXTR | 100.0% |
Fundamentals
| General | |
| Distribution Yield | -- |
| Dividend Yield TTM (5-28-26) | 1.61% |
| 30-Day SEC Yield | -- |
| 7-Day SEC Yield | -- |
| Number of Holdings | 8 |
| Bond | |
| Yield to Maturity (12-31-25) | -- |
| Effective Duration | -- |
| Average Coupon | -- |
| Calculated Average Quality | -- |
| Effective Maturity | -- |
| Nominal Maturity | -- |
| Number of Bond Holdings | 0 |
As of December 31, 2025
Fund Details
| Key Dates | |
| Inception Date | 8/30/2019 |
| Last Annual Report Date | 6/30/2025 |
| Last Prospectus Date | 11/1/2025 |
| Attributes | |
| Index Fund | -- |
| Inverse Fund | No |
| Leveraged Fund | -- |
| Fund of Funds |
|
| Currency Hedged Fund | -- |
| Socially Responsible Fund | No |
Top Portfolio Holders
| Name | % Weight |
|---|---|
| Portfolio A | 5.00% |
| Portfolio B | 3.50% |
| Portfolio C | 2.25% |
Excel Add-In Codes
| Name: =YCI("M:QSPMX", "name") |
| Broad Asset Class: =YCI("M:QSPMX", "broad_asset_class") |
| Broad Category: =YCI("M:QSPMX", "broad_category_group") |
| Prospectus Objective: =YCI("M:QSPMX", "prospectus_objective") |
| To find the codes for any of our securities and financial metrics, see our Complete Excel Reference. |