

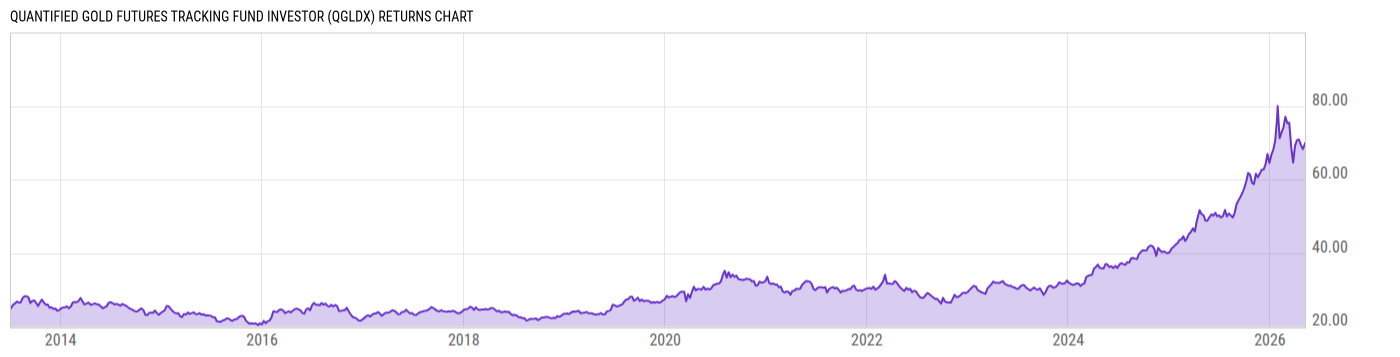
Quantified Gold Futures Tracking Fund Investor (QGLDX)
22.15
+0.10
(+0.45%)
USD |
May 08 2026
Returns Chart
Key Stats
| Net Expense Ratio | Total Assets Under Management | Weighted Average Dividend Yield | Turnover Ratio (Generic) |
|---|---|---|---|
| 1.50% | 138.25M | -- | 68.00% |
| 1 Year Fund Level Flows | 1 Year Total Returns (Daily) | Annualized Total Returns Since Inception (Daily) | Max Drawdown (Since Inception) |
| -69.85M | 40.04% |
Basic Info
| Investment Strategy | |
| The Fund seeks returns that reflect the performance of the price of Gold bullion. The Fund will invest primarily in Gold bullion-related ETFs, ETNs, ETF contracts, over-the-counter forward contracts and fixed income securities, including through mutual funds and ETFs that invest primarily in fixed income securities. |
| General | |
| Security Type | Mutual Fund |
| Equity Style | -- |
| Broad Asset Class | Sector Equity |
| Broad Category | Equity |
| Global Peer Group | Equity Sector Gold & Precious Metals |
| Peer Group | Precious Metals Equity Funds |
| Global Macro | Equity Industry Sector |
| US Macro | World Sector Equity Funds |
| YCharts Categorization | -- |
| YCharts Benchmark | -- |
| Prospectus Objective | Precious Metals Equity Funds |
| Fund Owner Firm Name | Advisors Preferred |
| Broad Asset Class Benchmark Index | |
| ^MSWNTR | 100.0% |
Net Fund Flows Versus Peer Group
1 Month
% Rank:
81
-228.04M
Peer Group Low
183.94M
Peer Group High
1 Year
% Rank:
67
-69.85M
-1.475B
Peer Group Low
1.377B
Peer Group High
3 Months
% Rank:
48
-1.051B
Peer Group Low
402.07M
Peer Group High
3 Years
% Rank:
66
-4.116B
Peer Group Low
1.561B
Peer Group High
6 Months
% Rank:
59
-1.475B
Peer Group Low
743.47M
Peer Group High
5 Years
% Rank:
66
-4.722B
Peer Group Low
1.749B
Peer Group High
YTD
% Rank:
66
-937.23M
Peer Group Low
941.12M
Peer Group High
10 Years
% Rank:
63
-1.488B
Peer Group Low
2.542B
Peer Group High
Date Unavailable
Risk
Performance Versus Peer Group
Annual Total Returns Versus Peers
As of May 10, 2026.
Asset Allocation
As of December 31, 2025.
| Type | % Net |
|---|---|
| Cash | 37.03% |
| Stock | 0.00% |
| Bond | 47.69% |
| Convertible | 0.00% |
| Preferred | 0.00% |
| Other | 15.28% |
Top 10 Holdings
| Name | % Weight | Price | % Change |
|---|---|---|---|
| Fidelity Instl Government Portfolio I | 76.15% | 1.00 | 0.00% |
|
Gold Bullion Strategy Fund
|
14.59% | -- | -- |
| iShares 0-3 Month Treasury Bond ETF | 4.25% | 100.48 | 0.03% |
|
StoneCastle
|
0.60% | -- | -- |
| Connexus Credit Union CONNEXC 4.0 08/30/2027 FIX USD Corporate | 0.53% | 100.27 | 0.10% |
| Axos Bank AXOSBAN 3.8 04/02/2027 FIX USD Corporate | 0.53% | 100.03 | 0.02% |
| Flushing Bank FLUSCOM 4.0 08/12/2026 FIX USD Corporate | 0.53% | 100.01 | 0.00% |
| Customers Bank CUSTOBA 4.0 08/17/2026 FIX USD Corporate | 0.53% | 99.99 | -0.03% |
| ALLY BANK ALLYBAN 3.75 09/27/2027 FIX USD Corporate | 0.53% | 99.92 | 0.15% |
| ESSA BANK & TRUST ESSABAN 3.7 09/25/2026 FIX USD Corporate | 0.53% | 99.84 | 0.00% |
Fees & Availability
| Fees | |
| Actual 12B-1 Fee | 0.25% |
| Actual Management Fee | 0.75% |
| Administration Fee | 269.6K% |
| Maximum Front Load | -- |
| Maximum Deferred Load | -- |
| Maximum Redemption Fee | 0.00% |
| General Availability | |
| Available for Insurance Product | No |
| Available for RRSP | No |
| Purchase Details | |
| Open to New Investors |
|
| Minimum Initial Investment | 1000.00 None |
| Minimum Subsequent Investment | 1000.00 None |
Basic Info
| Investment Strategy | |
| The Fund seeks returns that reflect the performance of the price of Gold bullion. The Fund will invest primarily in Gold bullion-related ETFs, ETNs, ETF contracts, over-the-counter forward contracts and fixed income securities, including through mutual funds and ETFs that invest primarily in fixed income securities. |
| General | |
| Security Type | Mutual Fund |
| Equity Style | -- |
| Broad Asset Class | Sector Equity |
| Broad Category | Equity |
| Global Peer Group | Equity Sector Gold & Precious Metals |
| Peer Group | Precious Metals Equity Funds |
| Global Macro | Equity Industry Sector |
| US Macro | World Sector Equity Funds |
| YCharts Categorization | -- |
| YCharts Benchmark | -- |
| Prospectus Objective | Precious Metals Equity Funds |
| Fund Owner Firm Name | Advisors Preferred |
| Broad Asset Class Benchmark Index | |
| ^MSWNTR | 100.0% |
Fundamentals
| General | |
| Distribution Yield | -- |
| Dividend Yield TTM (5-7-26) | 55.48% |
| 30-Day SEC Yield | -- |
| 7-Day SEC Yield | -- |
| Number of Holdings | 14 |
| Bond | |
| Yield to Maturity (12-31-25) | -- |
| Effective Duration | -- |
| Average Coupon | -- |
| Calculated Average Quality | -- |
| Effective Maturity | -- |
| Nominal Maturity | -- |
| Number of Bond Holdings | 0 |
As of December 31, 2025
Fund Details
| Key Dates | |
| Inception Date | 7/9/2013 |
| Last Annual Report Date | 12/31/2025 |
| Last Prospectus Date | 2/3/2026 |
| Share Classes | |
| QGLCX | Adv |
| Attributes | |
| Index Fund | -- |
| Inverse Fund | No |
| Leveraged Fund | -- |
| Fund of Funds |
|
| Currency Hedged Fund | -- |
| Socially Responsible Fund | No |
Top Portfolio Holders
| Name | % Weight |
|---|---|
| Portfolio A | 5.00% |
| Portfolio B | 3.50% |
| Portfolio C | 2.25% |
Excel Add-In Codes
| Name: =YCI("M:QGLDX", "name") |
| Broad Asset Class: =YCI("M:QGLDX", "broad_asset_class") |
| Broad Category: =YCI("M:QGLDX", "broad_category_group") |
| Prospectus Objective: =YCI("M:QGLDX", "prospectus_objective") |
| To find the codes for any of our securities and financial metrics, see our Complete Excel Reference. |