

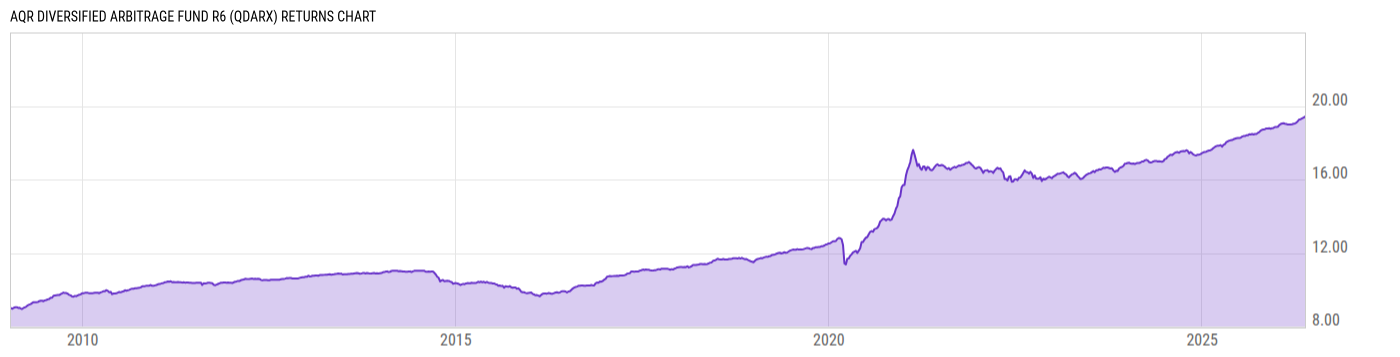
AQR Diversified Arbitrage Fund R6 (QDARX)
13.22
+0.01
(+0.08%)
USD |
Jun 09 2026
Returns Chart
Key Stats
| Net Expense Ratio | Total Assets Under Management | Weighted Average Dividend Yield | Turnover Ratio (Generic) |
|---|---|---|---|
| 1.66% | 2.625B | -- | 410.0% |
| 1 Year Fund Level Flows | 1 Year Total Returns (Daily) | Annualized Total Returns Since Inception (Daily) | Max Drawdown (Since Inception) |
| 554.53M | 6.82% |
Basic Info
| Investment Strategy | |
| The Fund seeks long-term absolute (positive) returns. The Fund seeks to outperform, after expenses, the ICE BofA US 3-Month Treasury Bill Index while seeking to control its tracking risk relative to this benchmark. The Index is designed to measure the performance of a high-quality short-term cash-equivalent investment. |
| General | |
| Security Type | Mutual Fund |
| Equity Style | -- |
| Broad Asset Class | Taxable Bond |
| Broad Category | Alternative Strategies |
| Global Peer Group | Absolute Return Bond USD |
| Peer Group | Absolute Return Bond Funds |
| Global Macro | Alternative Bond |
| US Macro | Alternative Bond Funds |
| YCharts Categorization | -- |
| YCharts Benchmark | -- |
| Prospectus Objective | Absolute Return Bond Funds |
| Fund Owner Firm Name | AQR |
| Broad Asset Class Benchmark Index | |
| ^BBUSATR | 100.0% |
Net Fund Flows Versus Peer Group
1 Month
% Rank:
3
-209.47M
Peer Group Low
154.84M
Peer Group High
1 Year
% Rank:
18
554.53M
-1.520B
Peer Group Low
1.173B
Peer Group High
3 Months
% Rank:
9
-434.27M
Peer Group Low
314.37M
Peer Group High
3 Years
% Rank:
29
-797.94M
Peer Group Low
4.557B
Peer Group High
6 Months
% Rank:
16
-735.93M
Peer Group Low
552.16M
Peer Group High
5 Years
% Rank:
16
-2.546B
Peer Group Low
4.706B
Peer Group High
YTD
% Rank:
16
-521.26M
Peer Group Low
591.05M
Peer Group High
10 Years
% Rank:
32
-6.734B
Peer Group Low
9.278B
Peer Group High
Date Unavailable
Risk
Performance Versus Peer Group
Annual Total Returns Versus Peers
As of June 10, 2026.
Asset Allocation
As of March 31, 2026.
| Type | % Net |
|---|---|
| Cash | -0.30% |
| Stock | -2.29% |
| Bond | 64.89% |
| Convertible | 0.00% |
| Preferred | 0.00% |
| Other | 37.70% |
Top 10 Holdings
| Name | % Weight | Price | % Change |
|---|---|---|---|
|
Limited Purpose Cash Investment Fund
|
31.26% | -- | -- |
| United States of America USGB 0.0 07/23/2026 FIX USD Government | 5.15% | 99.57 | 0.01% |
| United States of America USGB 0.0 07/09/2026 FIX USD Government | 3.87% | 99.71 | 0.01% |
| United States of America USGB 0.0 07/30/2026 FIX USD Government | 3.85% | 99.50 | 0.01% |
| United States of America USGB 0.0 07/02/2026 FIX USD Government | 3.56% | 99.78 | 0.01% |
| United States of America USGB 05/07/2026 FIX USD Government (Matured) | 3.06% | 100.00 | 0.02% |
| United States of America USGB 0.0 07/16/2026 FIX USD Government | 3.01% | 99.64 | 0.01% |
|
Electronic Arts Inc Swap Bullet
|
2.74% | -- | -- |
|
Penumbra Inc Swap Bullet
|
2.69% | -- | -- |
|
Chart Industries Inc Swap Bullet
|
2.68% | -- | -- |
Fees & Availability
| Fees | |
| Actual 12B-1 Fee | -- |
| Actual Management Fee | 1.00% |
| Administration Fee | 265.1K% |
| Maximum Front Load | -- |
| Maximum Deferred Load | -- |
| Maximum Redemption Fee | -- |
| General Availability | |
| Available for Insurance Product | No |
| Available for RRSP | No |
| Purchase Details | |
| Open to New Investors |
|
| Minimum Initial Investment | 50.00M None |
| Minimum Subsequent Investment | 0.00 None |
Basic Info
| Investment Strategy | |
| The Fund seeks long-term absolute (positive) returns. The Fund seeks to outperform, after expenses, the ICE BofA US 3-Month Treasury Bill Index while seeking to control its tracking risk relative to this benchmark. The Index is designed to measure the performance of a high-quality short-term cash-equivalent investment. |
| General | |
| Security Type | Mutual Fund |
| Equity Style | -- |
| Broad Asset Class | Taxable Bond |
| Broad Category | Alternative Strategies |
| Global Peer Group | Absolute Return Bond USD |
| Peer Group | Absolute Return Bond Funds |
| Global Macro | Alternative Bond |
| US Macro | Alternative Bond Funds |
| YCharts Categorization | -- |
| YCharts Benchmark | -- |
| Prospectus Objective | Absolute Return Bond Funds |
| Fund Owner Firm Name | AQR |
| Broad Asset Class Benchmark Index | |
| ^BBUSATR | 100.0% |
Fundamentals
| General | |
| Distribution Yield | -- |
| Dividend Yield TTM (6-8-26) | 2.15% |
| 30-Day SEC Yield | -- |
| 7-Day SEC Yield | -- |
| Number of Holdings | 728 |
Top Portfolio Holders
| Name | % Weight |
|---|---|
| Portfolio A | 5.00% |
| Portfolio B | 3.50% |
| Portfolio C | 2.25% |
Excel Add-In Codes
| Name: =YCI("M:QDARX", "name") |
| Broad Asset Class: =YCI("M:QDARX", "broad_asset_class") |
| Broad Category: =YCI("M:QDARX", "broad_category_group") |
| Prospectus Objective: =YCI("M:QDARX", "prospectus_objective") |
| To find the codes for any of our securities and financial metrics, see our Complete Excel Reference. |