

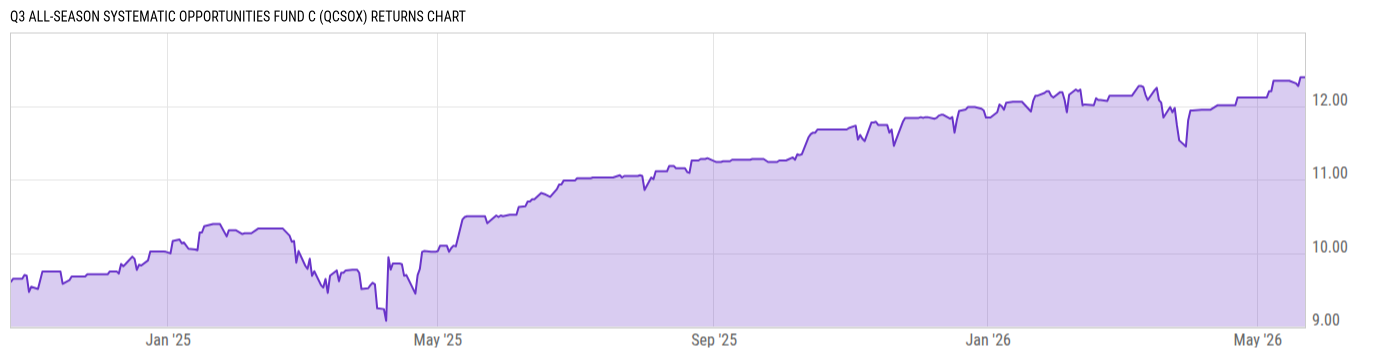
Q3 All-Season Systematic Opportunities Fund C (QCSOX)
10.49
-0.08
(-0.76%)
USD |
Jun 09 2026
Returns Chart
Key Stats
| Net Expense Ratio | Total Assets Under Management | Weighted Average Dividend Yield | Turnover Ratio (Generic) |
|---|---|---|---|
| 2.71% | 357.24M | -- | 147.0% |
| 1 Year Fund Level Flows | 1 Year Total Returns (Daily) | Annualized Total Returns Since Inception (Daily) | Max Drawdown (Since Inception) |
| 122.04M | 17.61% |
Basic Info
| Investment Strategy | |
| The Fund seeks capital appreciation by investing in other investment companies, including ETFs, open-end mutual funds, and closed-end funds and in individual fixed-income securities and equity options. The Advisers systematic framework determine if equity market environment have bullish or bearish price trends. |
| General | |
| Security Type | Mutual Fund |
| Equity Style | -- |
| Broad Asset Class | Allocation |
| Broad Category | Allocation |
| Global Peer Group | Mixed Asset USD Flexible - US |
| Peer Group | Flexible Portfolio Funds |
| Global Macro | Mixed Asset HC Flexible |
| US Macro | Mixed-Assets Funds |
| YCharts Categorization | -- |
| YCharts Benchmark | -- |
| Prospectus Objective | Flexible Portfolio Funds |
| Fund Owner Firm Name | Q3 Asset Management |
| Broad Asset Class Benchmark Index | |
| ^SPXTR | 100.0% |
Net Fund Flows Versus Peer Group
1 Month
% Rank:
7
-283.22M
Peer Group Low
1.386B
Peer Group High
1 Year
% Rank:
7
122.04M
-3.136B
Peer Group Low
12.22B
Peer Group High
3 Months
% Rank:
6
-727.84M
Peer Group Low
12.22B
Peer Group High
3 Years
% Rank:
9
-12.10B
Peer Group Low
12.22B
Peer Group High
6 Months
% Rank:
7
-1.420B
Peer Group Low
12.22B
Peer Group High
5 Years
% Rank:
10
-14.65B
Peer Group Low
12.22B
Peer Group High
YTD
% Rank:
7
-1.211B
Peer Group Low
12.22B
Peer Group High
10 Years
% Rank:
13
-47.19B
Peer Group Low
12.34B
Peer Group High
Date Unavailable
Risk
Performance Versus Peer Group
Annual Total Returns Versus Peers
As of June 10, 2026.
Asset Allocation
As of February 28, 2026.
| Type | % Net |
|---|---|
| Cash | 23.97% |
| Stock | 0.00% |
| Bond | 76.16% |
| Convertible | 0.00% |
| Preferred | 0.00% |
| Other | -0.13% |
Top 4 Holdings
| Name | % Weight | Price | % Change |
|---|---|---|---|
| BondBloxx Bloomberg 6 Mo Tgt Duration US Trsy ETF | 73.35% | 50.21 | 0.02% |
|
USD Cash
|
18.46% | -- | -- |
| First American Government Obligations Fd X | 8.25% | 1.00 | 0.00% |
|
Other Assets less Liabilities
|
-0.07% | -- | -- |
Fees & Availability
| Fees | |
| Actual 12B-1 Fee | 1.00% |
| Actual Management Fee | 0.64% |
| Administration Fee | 1.54K% |
| Maximum Front Load | -- |
| Maximum Deferred Load | -- |
| Maximum Redemption Fee | -- |
| General Availability | |
| Available for Insurance Product | No |
| Available for RRSP | No |
| Purchase Details | |
| Open to New Investors |
|
| Minimum Initial Investment | 1000.00 None |
| Minimum Subsequent Investment | 0.00 None |
Basic Info
| Investment Strategy | |
| The Fund seeks capital appreciation by investing in other investment companies, including ETFs, open-end mutual funds, and closed-end funds and in individual fixed-income securities and equity options. The Advisers systematic framework determine if equity market environment have bullish or bearish price trends. |
| General | |
| Security Type | Mutual Fund |
| Equity Style | -- |
| Broad Asset Class | Allocation |
| Broad Category | Allocation |
| Global Peer Group | Mixed Asset USD Flexible - US |
| Peer Group | Flexible Portfolio Funds |
| Global Macro | Mixed Asset HC Flexible |
| US Macro | Mixed-Assets Funds |
| YCharts Categorization | -- |
| YCharts Benchmark | -- |
| Prospectus Objective | Flexible Portfolio Funds |
| Fund Owner Firm Name | Q3 Asset Management |
| Broad Asset Class Benchmark Index | |
| ^SPXTR | 100.0% |
Fundamentals
| General | |
| Distribution Yield | -- |
| Dividend Yield TTM (6-8-26) | 0.26% |
| 30-Day SEC Yield | -- |
| 7-Day SEC Yield | -- |
| Number of Holdings | 4 |
| Bond | |
| Yield to Maturity (2-28-26) | 3.58% |
| Effective Duration | -- |
| Average Coupon | -- |
| Calculated Average Quality | 0.00 |
| Effective Maturity | 0.4459 |
| Nominal Maturity | 0.4459 |
| Number of Bond Holdings | 0 |
As of February 28, 2026
Fund Details
| Key Dates | |
| Inception Date | 10/18/2024 |
| Last Annual Report Date | 11/30/2025 |
| Last Prospectus Date | 3/30/2025 |
| Share Classes | |
| QASOX | Inst |
| Attributes | |
| Index Fund | -- |
| Inverse Fund | No |
| Leveraged Fund | -- |
| Fund of Funds | No |
| Currency Hedged Fund | -- |
| Socially Responsible Fund | No |
Top Portfolio Holders
| Name | % Weight |
|---|---|
| Portfolio A | 5.00% |
| Portfolio B | 3.50% |
| Portfolio C | 2.25% |
Excel Add-In Codes
| Name: =YCI("M:QCSOX", "name") |
| Broad Asset Class: =YCI("M:QCSOX", "broad_asset_class") |
| Broad Category: =YCI("M:QCSOX", "broad_category_group") |
| Prospectus Objective: =YCI("M:QCSOX", "prospectus_objective") |
| To find the codes for any of our securities and financial metrics, see our Complete Excel Reference. |