

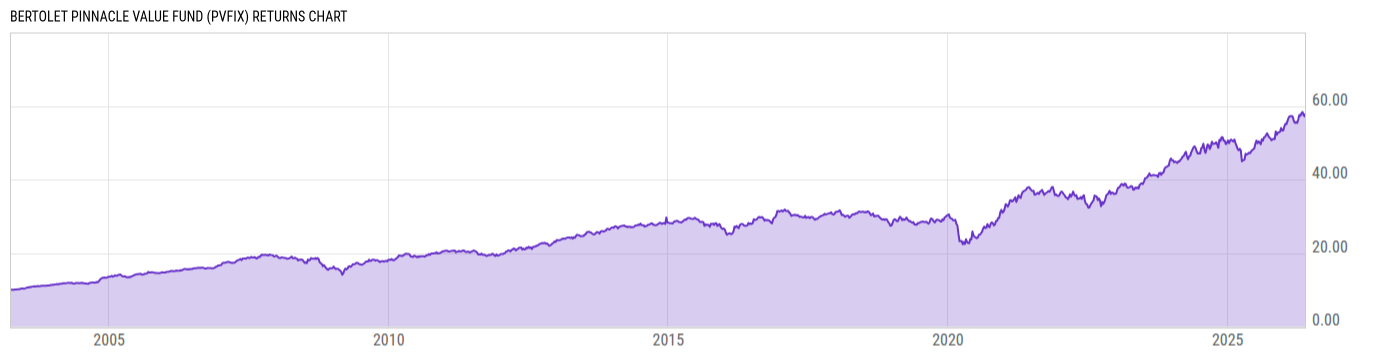
Bertolet Pinnacle Value Fund (PVFIX)
17.26
+0.04
(+0.23%)
USD |
May 21 2026
Returns Chart
Key Stats
| Net Expense Ratio | Total Assets Under Management | Weighted Average Dividend Yield | Turnover Ratio (Generic) |
|---|---|---|---|
| 1.24% | 37.68M | 0.93% | 24.00% |
| 1 Year Fund Level Flows | 1 Year Total Returns (Daily) | Annualized Total Returns Since Inception (Daily) | Max Drawdown (Since Inception) |
| -2.124M | 23.03% |
Basic Info
| Investment Strategy | |
| The Fund seeks long-term capital appreciation with income as a secondary objective. The Fund will invest in a diversified portfolio of securities issued by small and micro cap companies which the Fund's Adviser believes are trading at significant discounts to underlying earnings power or asset value. |
| General | |
| Security Type | Mutual Fund |
| Equity Style | Small Cap Value |
| Broad Asset Class | US Equity |
| Broad Category | Equity |
| Global Peer Group | Equity US Sm&Mid Cap |
| Peer Group | Small-Cap Value Funds |
| Global Macro | Equity North America |
| US Macro | Small-Cap Funds |
| YCharts Categorization | -- |
| YCharts Benchmark | -- |
| Prospectus Objective | Small-Cap Funds |
| Fund Owner Firm Name | Bertolet Capital |
| Broad Asset Class Benchmark Index | |
| ^SPXTR | 100.0% |
Net Fund Flows Versus Peer Group
1 Month
% Rank:
43
-327.65M
Peer Group Low
645.12M
Peer Group High
1 Year
% Rank:
39
-2.124M
-1.759B
Peer Group Low
4.582B
Peer Group High
3 Months
% Rank:
42
-493.33M
Peer Group Low
1.615B
Peer Group High
3 Years
% Rank:
35
-3.325B
Peer Group Low
12.92B
Peer Group High
6 Months
% Rank:
44
-1.270B
Peer Group Low
2.911B
Peer Group High
5 Years
% Rank:
35
-6.957B
Peer Group Low
17.35B
Peer Group High
YTD
% Rank:
41
-678.89M
Peer Group Low
2.366B
Peer Group High
10 Years
% Rank:
40
-9.794B
Peer Group Low
18.10B
Peer Group High
Date Unavailable
Risk
Performance Versus Peer Group
Annual Total Returns Versus Peers
As of May 22, 2026.
Asset Allocation
As of December 31, 2025.
| Type | % Net |
|---|---|
| Cash | 30.41% |
| Stock | 66.40% |
| Bond | 0.20% |
| Convertible | 0.00% |
| Preferred | 0.00% |
| Other | 2.99% |
Top 10 Holdings
| Name | % Weight | Price | % Change |
|---|---|---|---|
|
Cash and Cash Equivalents
|
30.40% | -- | -- |
|
Gulf Island Fabrication Inc ORD
|
11.58% | -- | -- |
| Hurco Cos., Inc. | 4.58% | 17.04 | 0.41% |
| Seaboard Corp. | 4.10% | 4946.02 | -1.66% |
| Unifi, Inc. | 3.61% | 4.055 | 1.88% |
| Ingles Markets, Inc. | 3.59% | 88.40 | 1.19% |
| Culp, Inc. (DELISTED) | 3.33% | 3.17 | -2.16% |
| Bristow Group, Inc. | 3.08% | 42.67 | -0.77% |
| Weyco Group, Inc. | 2.90% | 34.67 | 0.12% |
| First Acceptance Corp. | 2.72% | 5.20 | 0.97% |
Fees & Availability
| Fees | |
| Actual 12B-1 Fee | -- |
| Actual Management Fee | 0.95% |
| Administration Fee | -- |
| Maximum Front Load | -- |
| Maximum Deferred Load | -- |
| Maximum Redemption Fee | 1.00% |
| General Availability | |
| Available for Insurance Product | No |
| Available for RRSP | No |
| Purchase Details | |
| Open to New Investors |
|
| Minimum Initial Investment | 2500.00 None |
| Minimum Subsequent Investment | 100.00 None |
Basic Info
| Investment Strategy | |
| The Fund seeks long-term capital appreciation with income as a secondary objective. The Fund will invest in a diversified portfolio of securities issued by small and micro cap companies which the Fund's Adviser believes are trading at significant discounts to underlying earnings power or asset value. |
| General | |
| Security Type | Mutual Fund |
| Equity Style | Small Cap Value |
| Broad Asset Class | US Equity |
| Broad Category | Equity |
| Global Peer Group | Equity US Sm&Mid Cap |
| Peer Group | Small-Cap Value Funds |
| Global Macro | Equity North America |
| US Macro | Small-Cap Funds |
| YCharts Categorization | -- |
| YCharts Benchmark | -- |
| Prospectus Objective | Small-Cap Funds |
| Fund Owner Firm Name | Bertolet Capital |
| Broad Asset Class Benchmark Index | |
| ^SPXTR | 100.0% |
Fundamentals
| General | |
| Distribution Yield | -- |
| Dividend Yield TTM (5-20-26) | 1.21% |
| 30-Day SEC Yield | -- |
| 7-Day SEC Yield | -- |
| Number of Holdings | 41 |
| Stock | |
| Weighted Average PE Ratio | 18.64 |
| Weighted Average Price to Sales Ratio | 2.658 |
| Weighted Average Price to Book Ratio | 2.294 |
| Weighted Median ROE | 15.72% |
| Weighted Median ROA | 15.21% |
| ROI (TTM) | 15.52% |
| Return on Investment (TTM) | 15.52% |
| Earning Yield | 0.0764 |
| LT Debt / Shareholders Equity | 0.3081 |
| Number of Equity Holdings | 37 |
As of December 31, 2025
Growth Metrics
| EPS Growth (1Y) | 16.63% |
| EPS Growth (3Y) | -17.85% |
| EPS Growth (5Y) | 0.66% |
| Sales Growth (1Y) | -4.59% |
| Sales Growth (3Y) | 1.92% |
| Sales Growth (5Y) | -0.46% |
| Sales per Share Growth (1Y) | -5.69% |
| Sales per Share Growth (3Y) | 1.72% |
| Operating Cash Flow - Growth Rate (3Y) | 4.84% |
As of December 31, 2025
Fund Details
| Key Dates | |
| Inception Date | 4/1/2003 |
| Last Annual Report Date | 12/31/2025 |
| Last Prospectus Date | 5/1/2025 |
| Attributes | |
| Index Fund | -- |
| Inverse Fund | No |
| Leveraged Fund | -- |
| Fund of Funds | No |
| Currency Hedged Fund | -- |
| Socially Responsible Fund | No |
Top Portfolio Holders
| Name | % Weight |
|---|---|
| Portfolio A | 5.00% |
| Portfolio B | 3.50% |
| Portfolio C | 2.25% |
Excel Add-In Codes
| Name: =YCI("M:PVFIX", "name") |
| Broad Asset Class: =YCI("M:PVFIX", "broad_asset_class") |
| Broad Category: =YCI("M:PVFIX", "broad_category_group") |
| Prospectus Objective: =YCI("M:PVFIX", "prospectus_objective") |
| To find the codes for any of our securities and financial metrics, see our Complete Excel Reference. |