

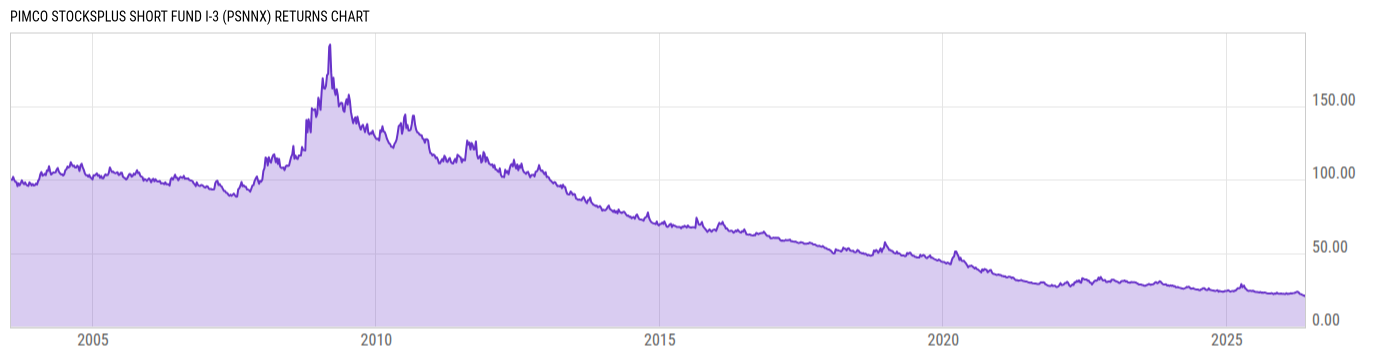
PIMCO StocksPLUS Short Fund I-3 (PSNNX)
6.14
+0.02
(+0.33%)
USD |
Jun 09 2026
Returns Chart
Key Stats
| Net Expense Ratio | Total Assets Under Management | Weighted Average Dividend Yield | Turnover Ratio (Generic) |
|---|---|---|---|
| 0.88% | 81.21M | -- | 503.0% |
| 1 Year Fund Level Flows | 1 Year Total Returns (Daily) | Annualized Total Returns Since Inception (Daily) | Max Drawdown (Since Inception) |
| 5.010M | -12.16% |
Basic Info
| Investment Strategy | |
| The Fund seeks total return through the implementation of short investment positions on the S&P 500 Index. The Fund invests primarily in short positions with respect to the S&P 500 Index, backed by a portfolio of fixed income instruments, such that the Fund's NAV will vary inversely to the value of the Index. |
| General | |
| Security Type | Mutual Fund |
| Equity Style | -- |
| Broad Asset Class | Alternative |
| Broad Category | Alternative Strategies |
| Global Peer Group | Alternative Dedicated Short Bias |
| Peer Group | Dedicated Short Bias Funds |
| Global Macro | Liquid Alternatives |
| US Macro | Alternative Equity Funds |
| YCharts Categorization | -- |
| YCharts Benchmark | -- |
| Prospectus Objective | Dedicated Short Bias Funds |
| Fund Owner Firm Name | PIMCO |
| Broad Asset Class Benchmark Index | |
| ^MSACWINTR | 100.0% |
Net Fund Flows Versus Peer Group
1 Month
% Rank:
72
-152.40M
Peer Group Low
1.341B
Peer Group High
1 Year
% Rank:
41
5.010M
-293.98M
Peer Group Low
5.411B
Peer Group High
3 Months
% Rank:
39
-61.63M
Peer Group Low
3.342B
Peer Group High
3 Years
% Rank:
97
-629.45M
Peer Group Low
6.163B
Peer Group High
6 Months
% Rank:
87
-168.84M
Peer Group Low
3.921B
Peer Group High
5 Years
% Rank:
99
-749.31M
Peer Group Low
9.495B
Peer Group High
YTD
% Rank:
33
-198.88M
Peer Group Low
3.850B
Peer Group High
10 Years
% Rank:
100
-1.014B
Peer Group Low
15.03B
Peer Group High
Date Unavailable
Risk
Performance Versus Peer Group
Annual Total Returns Versus Peers
As of June 10, 2026.
Asset Allocation
As of December 31, 2025.
| Type | % Net |
|---|---|
| Cash | -6.34% |
| Stock | 13.20% |
| Bond | 92.55% |
| Convertible | 0.00% |
| Preferred | 0.00% |
| Other | 0.58% |
Top 10 Holdings
| Name | % Weight | Price | % Change |
|---|---|---|---|
| FNMA-New 02/01/2053 FIX USD Agency | 31.87% | -- | -- |
| FNMA-New 02/01/2053 FIX USD Agency | 31.87% | -- | -- |
|
FEDERAL NATIONAL MORTGAGE ASSOCIATION 6% 01-JAN-2056
|
22.81% | -- | -- |
|
FEDERAL NATIONAL MORTGAGE ASSOCIATION 6% 01-JAN-2056
|
22.81% | -- | -- |
| iShares Core S&P 500 ETF | 13.23% | 737.69 | -0.41% |
| iShares Core S&P 500 ETF | 13.23% | 737.69 | -0.41% |
|
PIMCO SHORT ASSET PORTFOLIO
|
9.32% | -- | -- |
|
PIMCO SHORT ASSET PORTFOLIO
|
9.32% | -- | -- |
| FEDERAL NATIONAL MORTGAGE ASSOCIATION FNMA-New 5.0 12/02/2045 FIX USD Agency | 7.73% | -- | -- |
| FEDERAL NATIONAL MORTGAGE ASSOCIATION FNMA-New 5.0 12/02/2045 FIX USD Agency | 7.73% | -- | -- |
Fees & Availability
| Fees | |
| Actual 12B-1 Fee | -- |
| Actual Management Fee | 0.79% |
| Administration Fee | 9.69K% |
| Maximum Front Load | -- |
| Maximum Deferred Load | -- |
| Maximum Redemption Fee | -- |
| General Availability | |
| Available for Insurance Product | No |
| Available for RRSP | No |
| Purchase Details | |
| Open to New Investors |
|
| Minimum Initial Investment | 1.00M None |
| Minimum Subsequent Investment | 0.00 None |
Basic Info
| Investment Strategy | |
| The Fund seeks total return through the implementation of short investment positions on the S&P 500 Index. The Fund invests primarily in short positions with respect to the S&P 500 Index, backed by a portfolio of fixed income instruments, such that the Fund's NAV will vary inversely to the value of the Index. |
| General | |
| Security Type | Mutual Fund |
| Equity Style | -- |
| Broad Asset Class | Alternative |
| Broad Category | Alternative Strategies |
| Global Peer Group | Alternative Dedicated Short Bias |
| Peer Group | Dedicated Short Bias Funds |
| Global Macro | Liquid Alternatives |
| US Macro | Alternative Equity Funds |
| YCharts Categorization | -- |
| YCharts Benchmark | -- |
| Prospectus Objective | Dedicated Short Bias Funds |
| Fund Owner Firm Name | PIMCO |
| Broad Asset Class Benchmark Index | |
| ^MSACWINTR | 100.0% |
Fundamentals
| General | |
| Distribution Yield | -- |
| Dividend Yield TTM (6-8-26) | 4.41% |
| 30-Day SEC Yield (8-31-22) | 2.79% |
| 7-Day SEC Yield | -- |
| Number of Holdings | 1082 |
| Stock | |
| Weighted Average PE Ratio | 33.84 |
| Weighted Average Price to Sales Ratio | 9.061 |
| Weighted Average Price to Book Ratio | 11.65 |
| Weighted Median ROE | 66.36% |
| Weighted Median ROA | 17.92% |
| ROI (TTM) | 27.23% |
| Return on Investment (TTM) | 27.23% |
| Earning Yield | 0.0364 |
| LT Debt / Shareholders Equity | 1.016 |
| Number of Equity Holdings | 0 |
| Bond | |
| Yield to Maturity (12-31-25) | 5.08% |
| Effective Duration | -- |
| Average Coupon | 5.88% |
| Calculated Average Quality | 1.950 |
| Effective Maturity | 18.28 |
| Nominal Maturity | 18.28 |
| Number of Bond Holdings | 880 |
As of December 31, 2025
Growth Metrics
| EPS Growth (1Y) | 31.33% |
| EPS Growth (3Y) | 17.54% |
| EPS Growth (5Y) | 22.87% |
| Sales Growth (1Y) | 16.94% |
| Sales Growth (3Y) | 13.95% |
| Sales Growth (5Y) | 15.75% |
| Sales per Share Growth (1Y) | 20.87% |
| Sales per Share Growth (3Y) | 14.67% |
| Operating Cash Flow - Growth Rate (3Y) | 18.09% |
As of December 31, 2025
Top Portfolio Holders
| Name | % Weight |
|---|---|
| Portfolio A | 5.00% |
| Portfolio B | 3.50% |
| Portfolio C | 2.25% |
Excel Add-In Codes
| Name: =YCI("M:PSNNX", "name") |
| Broad Asset Class: =YCI("M:PSNNX", "broad_asset_class") |
| Broad Category: =YCI("M:PSNNX", "broad_category_group") |
| Prospectus Objective: =YCI("M:PSNNX", "prospectus_objective") |
| To find the codes for any of our securities and financial metrics, see our Complete Excel Reference. |