

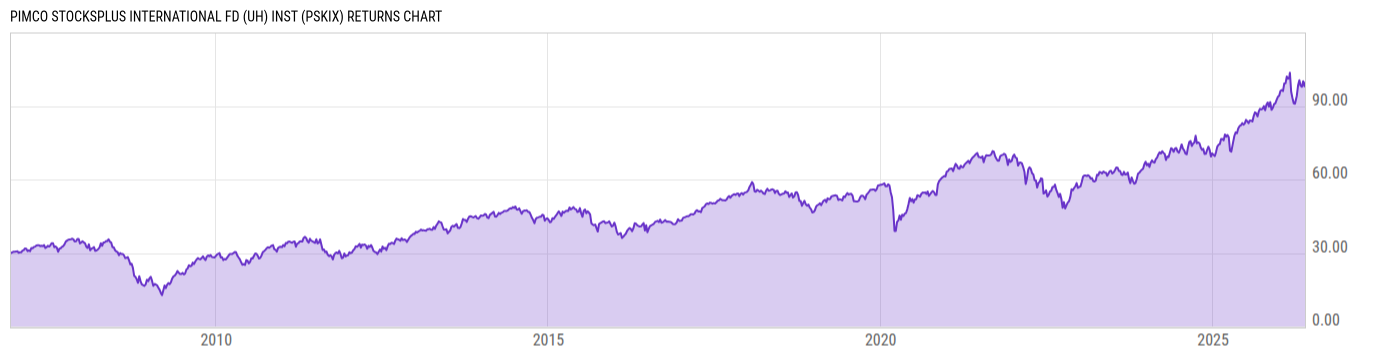
PIMCO StocksPLUS International Fd (Uh) Inst (PSKIX)
14.32
+0.02
(+0.14%)
USD |
Jun 09 2026
Returns Chart
Key Stats
| Net Expense Ratio | Total Assets Under Management | Weighted Average Dividend Yield | Turnover Ratio (Generic) |
|---|---|---|---|
| 0.79% | 194.89M | -- | 525.0% |
| 1 Year Fund Level Flows | 1 Year Total Returns (Daily) | Annualized Total Returns Since Inception (Daily) | Max Drawdown (Since Inception) |
| -29.32M | 20.13% |
Basic Info
| Investment Strategy | |
| The Fund seeks total return which exceeds that of its benchmark index (MSCI Europe, Australasia, and Far East (EAFE) Net Dividend Index) via investing in non-U.S. equity derivatives, backed by a portfolio of fixed income instruments. The Fund may invest in common stocks, options, futures, options on futures and swaps. |
| General | |
| Security Type | Mutual Fund |
| Equity Style | -- |
| Broad Asset Class | International Equity |
| Broad Category | Equity |
| Global Peer Group | Equity Global ex US |
| Peer Group | International Multi-Cap Core |
| Global Macro | Equity Global |
| US Macro | Developed International Markets Funds |
| YCharts Categorization | -- |
| YCharts Benchmark | -- |
| Prospectus Objective | International Funds |
| Fund Owner Firm Name | PIMCO |
| Broad Asset Class Benchmark Index | |
| ^MSACXUSNTR | 100.0% |
Net Fund Flows Versus Peer Group
1 Month
% Rank:
35
-646.86M
Peer Group Low
1.249B
Peer Group High
1 Year
% Rank:
53
-29.32M
-2.585B
Peer Group Low
21.10B
Peer Group High
3 Months
% Rank:
37
-549.38M
Peer Group Low
4.345B
Peer Group High
3 Years
% Rank:
55
-7.696B
Peer Group Low
38.72B
Peer Group High
6 Months
% Rank:
45
-1.564B
Peer Group Low
11.05B
Peer Group High
5 Years
% Rank:
56
-14.83B
Peer Group Low
61.92B
Peer Group High
YTD
% Rank:
45
-2.573B
Peer Group Low
7.616B
Peer Group High
10 Years
% Rank:
85
-43.26B
Peer Group Low
117.68B
Peer Group High
Date Unavailable
Risk
Performance Versus Peer Group
Annual Total Returns Versus Peers
As of June 10, 2026.
Asset Allocation
As of December 31, 2025.
| Type | % Net |
|---|---|
| Cash | 10.64% |
| Stock | 13.90% |
| Bond | 73.24% |
| Convertible | 0.00% |
| Preferred | 0.00% |
| Other | 2.21% |
Top 10 Holdings
| Name | % Weight | Price | % Change |
|---|---|---|---|
| FEDERAL NATIONAL MORTGAGE ASSOCIATION FNMA-New 6.0 07/25/2036 FIX USD Agency | 21.57% | -- | -- |
|
Federal National Mortgage Association 6.5%
|
17.72% | -- | -- |
|
Bofa Securities Inc Repo
|
16.73% | -- | -- |
| iShares Core S&P 500 ETF | 13.93% | 739.90 | -0.11% |
| FNMA-New 02/01/2053 FIX USD Agency | 8.11% | -- | -- |
| FEDERAL NATIONAL MORTGAGE ASSOCIATION FNMA-New 5.0 12/02/2045 FIX USD Agency | 7.48% | -- | -- |
|
PIMCO Short Asset Portfolio
|
6.09% | -- | -- |
|
Federal Home Loan Mortgage Corp 01-NOV-2054 SD8475
|
4.42% | -- | -- |
|
Government National Mortgage Association 2 4% 01-FEB-2056
|
3.19% | -- | -- |
|
Government National Mortgage Association 2 3.5% 01-FEB-2056
|
2.93% | -- | -- |
Fees & Availability
| Fees | |
| Actual 12B-1 Fee | -- |
| Actual Management Fee | 0.64% |
| Administration Fee | 250.9K% |
| Maximum Front Load | -- |
| Maximum Deferred Load | -- |
| Maximum Redemption Fee | 0.00% |
| General Availability | |
| Available for Insurance Product | No |
| Available for RRSP | No |
| Purchase Details | |
| Open to New Investors |
|
| Minimum Initial Investment | 1.00M None |
| Minimum Subsequent Investment | 0.00 None |
Basic Info
| Investment Strategy | |
| The Fund seeks total return which exceeds that of its benchmark index (MSCI Europe, Australasia, and Far East (EAFE) Net Dividend Index) via investing in non-U.S. equity derivatives, backed by a portfolio of fixed income instruments. The Fund may invest in common stocks, options, futures, options on futures and swaps. |
| General | |
| Security Type | Mutual Fund |
| Equity Style | -- |
| Broad Asset Class | International Equity |
| Broad Category | Equity |
| Global Peer Group | Equity Global ex US |
| Peer Group | International Multi-Cap Core |
| Global Macro | Equity Global |
| US Macro | Developed International Markets Funds |
| YCharts Categorization | -- |
| YCharts Benchmark | -- |
| Prospectus Objective | International Funds |
| Fund Owner Firm Name | PIMCO |
| Broad Asset Class Benchmark Index | |
| ^MSACXUSNTR | 100.0% |
Fundamentals
| General | |
| Distribution Yield | -- |
| Dividend Yield TTM (6-8-26) | 3.48% |
| 30-Day SEC Yield (4-30-26) | 4.55% |
| 7-Day SEC Yield | -- |
| Number of Holdings | 453 |
| Stock | |
| Weighted Average PE Ratio | 33.84 |
| Weighted Average Price to Sales Ratio | 9.061 |
| Weighted Average Price to Book Ratio | 11.65 |
| Weighted Median ROE | 66.36% |
| Weighted Median ROA | 17.92% |
| ROI (TTM) | 27.23% |
| Return on Investment (TTM) | 27.23% |
| Earning Yield | 0.0364 |
| LT Debt / Shareholders Equity | 1.016 |
| Number of Equity Holdings | 0 |
| Bond | |
| Yield to Maturity (12-31-25) | -- |
| Effective Duration | -- |
| Average Coupon | -- |
| Calculated Average Quality | -- |
| Effective Maturity | -- |
| Nominal Maturity | -- |
| Number of Bond Holdings | 337 |
As of December 31, 2025
Growth Metrics
| EPS Growth (1Y) | 31.33% |
| EPS Growth (3Y) | 17.54% |
| EPS Growth (5Y) | 22.87% |
| Sales Growth (1Y) | 16.94% |
| Sales Growth (3Y) | 13.95% |
| Sales Growth (5Y) | 15.75% |
| Sales per Share Growth (1Y) | 20.87% |
| Sales per Share Growth (3Y) | 14.67% |
| Operating Cash Flow - Growth Rate (3Y) | 18.09% |
As of December 31, 2025
Top Portfolio Holders
| Name | % Weight |
|---|---|
| Portfolio A | 5.00% |
| Portfolio B | 3.50% |
| Portfolio C | 2.25% |
Excel Add-In Codes
| Name: =YCI("M:PSKIX", "name") |
| Broad Asset Class: =YCI("M:PSKIX", "broad_asset_class") |
| Broad Category: =YCI("M:PSKIX", "broad_category_group") |
| Prospectus Objective: =YCI("M:PSKIX", "prospectus_objective") |
| To find the codes for any of our securities and financial metrics, see our Complete Excel Reference. |