

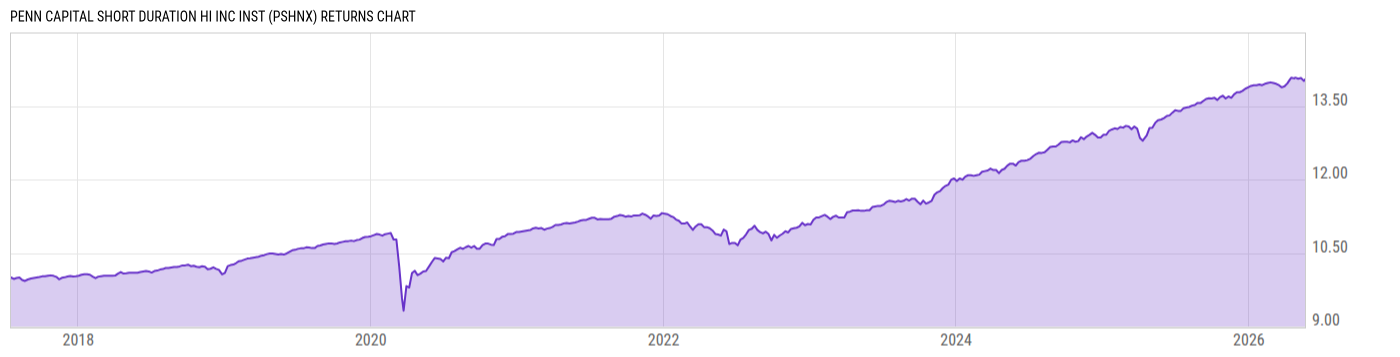
Penn Capital Short Duration Hi Inc Inst (PSHNX)
9.54
0.00 (0.00%)
USD |
Jun 09 2026
Returns Chart
Key Stats
| Net Expense Ratio | Total Assets Under Management | Weighted Average Dividend Yield | Turnover Ratio (Generic) |
|---|---|---|---|
| 0.54% | 20.22M | -- | 59.00% |
| 1 Year Fund Level Flows | 1 Year Total Returns (Daily) | Annualized Total Returns Since Inception (Daily) | Max Drawdown (Since Inception) |
| 1.522M | 6.00% |
Basic Info
| Investment Strategy | |
| The Fund seeks to provide a high level of current income. The Fund invests primarily in high yield fixed income securities and senior floating rate loans that are rated below investment grade, BBB-, or lower at the time of purchase, or if unrated, determined by the Advisor to be of comparable credit quality. |
| General | |
| Security Type | Mutual Fund |
| Equity Style | -- |
| Broad Asset Class | Taxable Bond |
| Broad Category | Fixed Income |
| Global Peer Group | Bond USD High Yield |
| Peer Group | Short High Yield Funds |
| Global Macro | Bond High Yield |
| US Macro | High Yield Funds |
| YCharts Categorization | -- |
| YCharts Benchmark | -- |
| Prospectus Objective | Short High Yield Funds |
| Fund Owner Firm Name | Penn Capital |
| Broad Asset Class Benchmark Index | |
| ^BBUSATR | 100.0% |
Net Fund Flows Versus Peer Group
1 Month
% Rank:
50
-19.58M
Peer Group Low
108.89M
Peer Group High
1 Year
% Rank:
63
1.522M
-186.17M
Peer Group Low
1.374B
Peer Group High
3 Months
% Rank:
47
-374.92M
Peer Group Low
476.36M
Peer Group High
3 Years
% Rank:
64
-428.04M
Peer Group Low
7.937B
Peer Group High
6 Months
% Rank:
53
-600.15M
Peer Group Low
534.52M
Peer Group High
5 Years
% Rank:
70
-918.94M
Peer Group Low
8.753B
Peer Group High
YTD
% Rank:
53
-547.97M
Peer Group Low
495.43M
Peer Group High
10 Years
% Rank:
64
-704.35M
Peer Group Low
8.768B
Peer Group High
Date Unavailable
Risk
Performance Versus Peer Group
Annual Total Returns Versus Peers
As of June 10, 2026.
Asset Allocation
As of April 30, 2026.
| Type | % Net |
|---|---|
| Cash | -0.70% |
| Stock | 0.00% |
| Bond | 99.19% |
| Convertible | 0.00% |
| Preferred | 0.00% |
| Other | 1.50% |
Top 10 Holdings
| Name | % Weight | Price | % Change |
|---|---|---|---|
| Acadia Healthcare Company, Inc. ACADHEA 5.5 07/01/2028 FIX USD Corporate 144A | 2.97% | 99.38 | -0.09% |
| CCO Holdings, LLC CHTR-CCOH 5.0 02/01/2028 FIX USD Corporate 144A | 2.93% | 98.60 | 0.05% |
| AMERICAN AIRLINES, INC. AMR-AmAirlines 7.25 02/15/2028 FIX USD Corporate 144A | 2.61% | 101.29 | -0.00% |
| Owens-Brockway Glass Container Inc. OI-Brockway 05/13/2027 FIX USD Corporate 144A (Called) | 2.26% | 100.12 | -0.01% |
| OneMain Finance Corporation ONEMFIAK 6.625 01/15/2028 FIX USD Corporate | 2.24% | 101.46 | -0.01% |
| HARVEST MIDSTREAM I, L.P. HARMID 09/01/2028 FIX USD Corporate 144A (Called) | 2.15% | 101.37 | 0.09% |
| PRA Group, Inc. PRAGRO 8.375 02/01/2028 FIX USD Corporate 144A | 2.12% | 101.54 | -0.01% |
| ADAPTHEALTH LLC ADAPLLC 6.125 08/01/2028 FIX USD Corporate 144A | 2.07% | 100.21 | 0.12% |
| Match Group Holdings II, LLC MATCHGR 5.0 12/15/2027 FIX USD Corporate 144A | 1.86% | 99.70 | -0.02% |
| GGAM Finance Ltd. GGAMFIN 8.0 02/15/2027 FIX USD Corporate 144A | 1.70% | 100.54 | -0.16% |
Fees & Availability
| Fees | |
| Actual 12B-1 Fee | 0.00% |
| Actual Management Fee | -- |
| Administration Fee | 44.03K% |
| Maximum Front Load | -- |
| Maximum Deferred Load | -- |
| Maximum Redemption Fee | 0.00% |
| General Availability | |
| Available for Insurance Product | No |
| Available for RRSP | No |
| Purchase Details | |
| Open to New Investors |
|
| Minimum Initial Investment | 10000.00 None |
| Minimum Subsequent Investment | 100.00 None |
Basic Info
| Investment Strategy | |
| The Fund seeks to provide a high level of current income. The Fund invests primarily in high yield fixed income securities and senior floating rate loans that are rated below investment grade, BBB-, or lower at the time of purchase, or if unrated, determined by the Advisor to be of comparable credit quality. |
| General | |
| Security Type | Mutual Fund |
| Equity Style | -- |
| Broad Asset Class | Taxable Bond |
| Broad Category | Fixed Income |
| Global Peer Group | Bond USD High Yield |
| Peer Group | Short High Yield Funds |
| Global Macro | Bond High Yield |
| US Macro | High Yield Funds |
| YCharts Categorization | -- |
| YCharts Benchmark | -- |
| Prospectus Objective | Short High Yield Funds |
| Fund Owner Firm Name | Penn Capital |
| Broad Asset Class Benchmark Index | |
| ^BBUSATR | 100.0% |
Fundamentals
| General | |
| Distribution Yield | -- |
| Dividend Yield TTM (6-8-26) | 6.08% |
| 30-Day SEC Yield (5-31-26) | 5.46% |
| 7-Day SEC Yield | -- |
| Number of Holdings | 89 |
| Bond | |
| Yield to Maturity (4-30-26) | 6.49% |
| Effective Duration | -- |
| Average Coupon | 6.80% |
| Calculated Average Quality | 5.496 |
| Effective Maturity | 2.259 |
| Nominal Maturity | 2.789 |
| Number of Bond Holdings | 87 |
As of April 30, 2026
Fund Details
| Key Dates | |
| Inception Date | 7/17/2017 |
| Last Annual Report Date | 8/31/2025 |
| Last Prospectus Date | 12/31/2025 |
| Attributes | |
| Index Fund | -- |
| Inverse Fund | No |
| Leveraged Fund | -- |
| Fund of Funds | No |
| Currency Hedged Fund | -- |
| Socially Responsible Fund | No |
Top Portfolio Holders
| Name | % Weight |
|---|---|
| Portfolio A | 5.00% |
| Portfolio B | 3.50% |
| Portfolio C | 2.25% |
Excel Add-In Codes
| Name: =YCI("M:PSHNX", "name") |
| Broad Asset Class: =YCI("M:PSHNX", "broad_asset_class") |
| Broad Category: =YCI("M:PSHNX", "broad_category_group") |
| Prospectus Objective: =YCI("M:PSHNX", "prospectus_objective") |
| To find the codes for any of our securities and financial metrics, see our Complete Excel Reference. |