

Putnam Retirement Advantage Plus Maturity Fund R6 (PREWX)
17.28
0.00 (0.00%)
USD |
Jun 09 2026
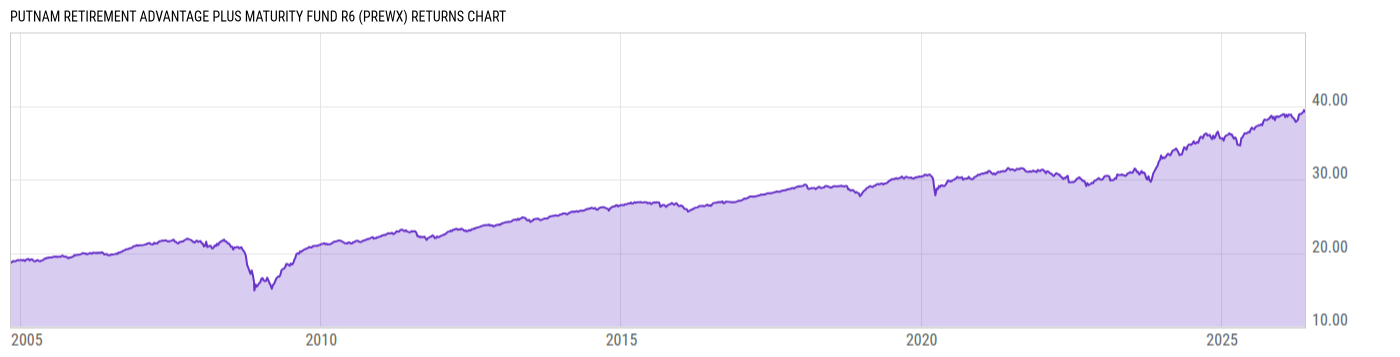
Returns Chart
Key Stats
| Net Expense Ratio | Total Assets Under Management | Weighted Average Dividend Yield | Turnover Ratio (Generic) |
|---|---|---|---|
| 0.58% | 632.56M | -- | 10.00% |
| 1 Year Fund Level Flows | 1 Year Total Returns (Daily) | Annualized Total Returns Since Inception (Daily) | Max Drawdown (Since Inception) |
| -36.75M | 7.94% |
Basic Info
| Investment Strategy | |
| The Fund seeks as high a rate of current income as is consistent with preservation of capital. The Fund seeks to employ an asset allocation strategy designed for investors who are already in retirement or those who plan to retire, or otherwise begin withdrawing the invested funds, in the near future. |
| General | |
| Security Type | Mutual Fund |
| Equity Style | -- |
| Broad Asset Class | Allocation |
| Broad Category | Allocation |
| Global Peer Group | Mixed Asset USD Balanced - US |
| Peer Group | Mixed-Asset Target Today Funds |
| Global Macro | Mixed Asset HC Balanced |
| US Macro | Mixed-Assets Target Date Funds |
| YCharts Categorization | -- |
| YCharts Benchmark | -- |
| Prospectus Objective | Income Funds |
| Fund Owner Firm Name | Franklin Templeton |
| Broad Asset Class Benchmark Index | |
| ^SPXTR | 100.0% |
Net Fund Flows Versus Peer Group
1 Month
% Rank:
63
-439.86M
Peer Group Low
24.02M
Peer Group High
1 Year
% Rank:
50
-36.75M
-2.883B
Peer Group Low
168.63M
Peer Group High
3 Months
% Rank:
60
-1.037B
Peer Group Low
70.52M
Peer Group High
3 Years
% Rank:
48
-10.21B
Peer Group Low
158.60M
Peer Group High
6 Months
% Rank:
50
-1.652B
Peer Group Low
120.79M
Peer Group High
5 Years
% Rank:
53
-14.75B
Peer Group Low
475.86M
Peer Group High
YTD
% Rank:
50
-1.388B
Peer Group Low
93.37M
Peer Group High
10 Years
% Rank:
53
-18.46B
Peer Group Low
1.158B
Peer Group High
Date Unavailable
Risk
Performance Versus Peer Group
Annual Total Returns Versus Peers
As of June 11, 2026.
Asset Allocation
As of April 30, 2026.
| Type | % Net |
|---|---|
| Cash | -2.34% |
| Stock | 25.70% |
| Bond | 45.53% |
| Convertible | 0.03% |
| Preferred | 0.07% |
| Other | 31.01% |
Top 6 Holdings
| Name | % Weight | Price | % Change |
|---|---|---|---|
| Putnam Multi-Asset Income P | 79.72% | 11.61 | 0.00% |
| Putnam Dynamic Asset Allocation Balanced Fund P | 6.74% | 17.84 | 0.00% |
|
PUTNAM SHORT TERM INVESTMENT FUND
|
5.85% | -- | -- |
| Franklin BSP Lending Fund R6 | 3.98% | 10.14 | 0.00% |
| Clarion Partners Real Estate Income Fund Inc I | 3.96% | 11.29 | 0.00% |
|
CASH AND CASH EQUIVALENTS
|
-0.25% | -- | -- |
Fees & Availability
| Fees | |
| Actual 12B-1 Fee | -- |
| Actual Management Fee | -- |
| Administration Fee | -- |
| Maximum Front Load | -- |
| Maximum Deferred Load | -- |
| Maximum Redemption Fee | -- |
| General Availability | |
| Available for Insurance Product | No |
| Available for RRSP | No |
| Purchase Details | |
| Open to New Investors |
|
| Minimum Initial Investment | 500.00 None |
| Minimum Subsequent Investment | 0.00 None |
Basic Info
| Investment Strategy | |
| The Fund seeks as high a rate of current income as is consistent with preservation of capital. The Fund seeks to employ an asset allocation strategy designed for investors who are already in retirement or those who plan to retire, or otherwise begin withdrawing the invested funds, in the near future. |
| General | |
| Security Type | Mutual Fund |
| Equity Style | -- |
| Broad Asset Class | Allocation |
| Broad Category | Allocation |
| Global Peer Group | Mixed Asset USD Balanced - US |
| Peer Group | Mixed-Asset Target Today Funds |
| Global Macro | Mixed Asset HC Balanced |
| US Macro | Mixed-Assets Target Date Funds |
| YCharts Categorization | -- |
| YCharts Benchmark | -- |
| Prospectus Objective | Income Funds |
| Fund Owner Firm Name | Franklin Templeton |
| Broad Asset Class Benchmark Index | |
| ^SPXTR | 100.0% |
Fundamentals
| General | |
| Distribution Yield | -- |
| Dividend Yield TTM (6-8-26) | 3.78% |
| 30-Day SEC Yield (4-30-26) | 3.69% |
| 7-Day SEC Yield | -- |
| Number of Holdings | 6 |
| Stock | |
| Weighted Average PE Ratio | 25.49 |
| Weighted Average Price to Sales Ratio | 6.137 |
| Weighted Average Price to Book Ratio | 9.415 |
| Weighted Median ROE | 46.47% |
| Weighted Median ROA | 14.54% |
| ROI (TTM) | 22.07% |
| Return on Investment (TTM) | 22.07% |
| Earning Yield | 0.0529 |
| LT Debt / Shareholders Equity | 0.9130 |
| Number of Equity Holdings | 0 |
| Bond | |
| Yield to Maturity (4-30-26) | 5.47% |
| Effective Duration | 3.77 |
| Average Coupon | 5.34% |
| Calculated Average Quality | 3.200 |
| Effective Maturity | 14.42 |
| Nominal Maturity | 14.50 |
| Number of Bond Holdings | 0 |
As of April 30, 2026
Growth Metrics
| EPS Growth (1Y) | 22.35% |
| EPS Growth (3Y) | 17.91% |
| EPS Growth (5Y) | 26.07% |
| Sales Growth (1Y) | 12.70% |
| Sales Growth (3Y) | 13.03% |
| Sales Growth (5Y) | 14.41% |
| Sales per Share Growth (1Y) | 24.29% |
| Sales per Share Growth (3Y) | 13.90% |
| Operating Cash Flow - Growth Rate (3Y) | 23.78% |
As of April 30, 2026
Fund Details
| Key Dates | |
| Inception Date | 11/1/2004 |
| Last Annual Report Date | 7/31/2025 |
| Last Prospectus Date | 4/17/2026 |
| Share Classes | |
| PACKX | Retirement |
| PACPX | Retirement |
| PACQX | Retirement |
| PRMAX | A |
| PRMCX | C |
| PRMKX | Retirement |
| PRMYX | Inst |
| Attributes | |
| Index Fund | -- |
| Inverse Fund | No |
| Leveraged Fund | -- |
| Fund of Funds |
|
| Currency Hedged Fund | -- |
| Socially Responsible Fund |
|
Top Portfolio Holders
| Name | % Weight |
|---|---|
| Portfolio A | 5.00% |
| Portfolio B | 3.50% |
| Portfolio C | 2.25% |
Excel Add-In Codes
| Name: =YCI("M:PREWX", "name") |
| Broad Asset Class: =YCI("M:PREWX", "broad_asset_class") |
| Broad Category: =YCI("M:PREWX", "broad_category_group") |
| Prospectus Objective: =YCI("M:PREWX", "prospectus_objective") |
| To find the codes for any of our securities and financial metrics, see our Complete Excel Reference. |