

T Rowe Price New Asia Fund (PRASX)
25.61
+0.99
(+4.02%)
USD |
Jul 21 2026
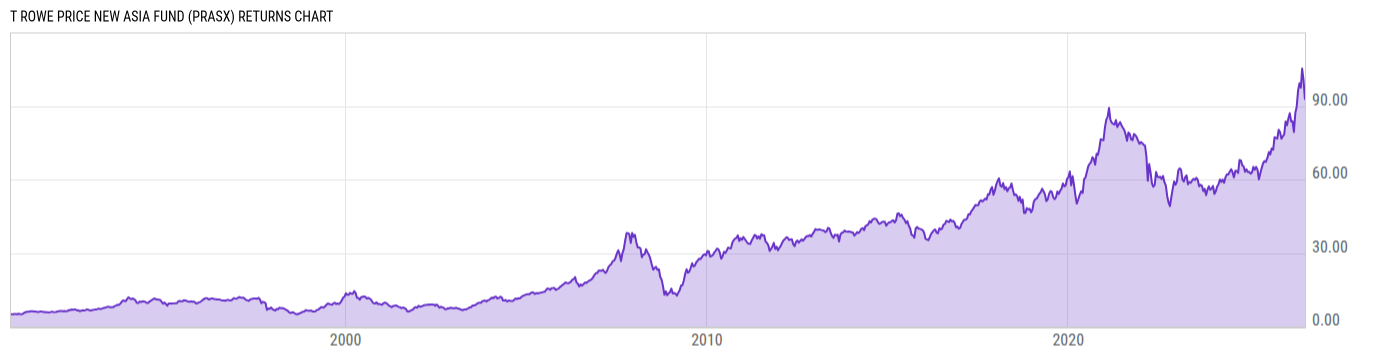
Returns Chart
Key Stats
| Net Expense Ratio | Total Assets Under Management | Weighted Average Dividend Yield | Turnover Ratio (Generic) |
|---|---|---|---|
| 1.03% | 2.480B | 1.57% | 53.00% |
| 1 Year Fund Level Flows | 1 Year Total Returns (Daily) | Annualized Total Returns Since Inception (Daily) | Max Drawdown (Since Inception) |
| -110.27M | 35.73% |
Basic Info
| Investment Strategy | |
| The Fund seeks long-term growth of capital by investing in both large and small capitalization companies domiciled, or with primary operations, in Asia, excluding Japan. |
| General | |
| Security Type | Mutual Fund |
| Equity Style | Large Cap Growth |
| Broad Asset Class | International Equity |
| Broad Category | Equity |
| Global Peer Group | Equity Asia Pacific ex Japan |
| Peer Group | Pacific Ex Japan Funds |
| Global Macro | Equity Asia Pacific |
| US Macro | Developed International Markets Funds |
| YCharts Categorization | -- |
| YCharts Benchmark | -- |
| Prospectus Objective | Pacific Ex Japan Funds |
| Fund Owner Firm Name | T. Rowe Price |
| Broad Asset Class Benchmark Index | |
| ^MSACXUSNTR | 100.0% |
Net Fund Flows Versus Peer Group
1 Month
% Rank:
94
-88.44M
Peer Group Low
729.15M
Peer Group High
1 Year
% Rank:
91
-110.27M
-171.76M
Peer Group Low
5.485B
Peer Group High
3 Months
% Rank:
19
-1.805B
Peer Group Low
671.69M
Peer Group High
3 Years
% Rank:
91
-3.058B
Peer Group Low
6.418B
Peer Group High
6 Months
% Rank:
97
-122.80M
Peer Group Low
4.269B
Peer Group High
5 Years
% Rank:
88
-6.551B
Peer Group Low
4.956B
Peer Group High
YTD
% Rank:
97
-122.80M
Peer Group Low
4.269B
Peer Group High
10 Years
% Rank:
91
-8.208B
Peer Group Low
5.231B
Peer Group High
Date Unavailable
Risk
Performance Versus Peer Group
Annual Total Returns Versus Peers
As of July 22, 2026.
Asset Allocation
As of March 31, 2026.
| Type | % Net |
|---|---|
| Cash | 1.39% |
| Stock | 96.30% |
| Bond | 0.79% |
| Convertible | 0.00% |
| Preferred | 0.00% |
| Other | 1.52% |
Top 10 Holdings
| Name | % Weight | Price | % Change |
|---|---|---|---|
| Taiwan Semiconductor Manufacturing Co., Ltd. | 18.81% | 17.24 | 0.00% |
| Samsung Electronics Co., Ltd. | 11.12% | 140.00 | 0.00% |
|
SK Hynix Inc ORD
|
9.13% | -- | -- |
| Tencent Holdings Ltd. | 3.61% | 58.81 | -4.38% |
| DBS Group Holdings Ltd. | 2.55% | 56.42 | 1.18% |
|
Delta Electronics Inc ORD
|
2.33% | -- | -- |
|
MediaTek Inc ORD
|
2.27% | -- | -- |
|
Zhongji Innolight Co Ltd ORD
|
2.01% | -- | -- |
|
ICICI Bank Ltd ORD
|
1.88% | -- | -- |
|
Jiangsu Zhongtian Technology Co Ltd ORD
|
1.67% | -- | -- |
Fees & Availability
| Fees | |
| Actual 12B-1 Fee | -- |
| Actual Management Fee | 0.78% |
| Administration Fee | -- |
| Maximum Front Load | -- |
| Maximum Deferred Load | -- |
| Maximum Redemption Fee | 0.00% |
| General Availability | |
| Available for Insurance Product | No |
| Available for RRSP | No |
| Purchase Details | |
| Open to New Investors |
|
| Minimum Initial Investment | 2500.00 None |
| Minimum Subsequent Investment | 100.00 None |
Projected Income
| Type | Jul | Aug | Sep | Oct | Nov | Dec | Jan | Feb | Mar | Apr | May | Jun |
|---|---|---|---|---|---|---|---|---|---|---|---|---|
|
Qualified Income
|
-- | -- | -- | -- | -- | -- | -- | -- | -- | -- | -- | -- |
|
Normal
|
-- | -- | -- | -- | -- | -- | -- | -- | -- | -- | -- | -- |
|
Qualified
|
-- | -- | -- | -- | -- | -- | -- | -- | -- | -- | -- | -- |
|
LT Cap Gains
|
-- | -- | -- | -- | -- | -- | -- | -- | -- | -- | -- | -- |
|
Ordinary Income
|
-- | -- | -- | -- | -- | -- | -- | -- | -- | -- | -- | -- |
|
Non-Qual
|
-- | -- | -- | -- | -- | -- | -- | -- | -- | -- | -- | -- |
|
ST Cap Gains
|
-- | -- | -- | -- | -- | -- | -- | -- | -- | -- | -- | -- |
|
Interest
|
-- | -- | -- | -- | -- | -- | -- | -- | -- | -- | -- | -- |
|
Tax-Exempt
|
-- | -- | -- | -- | -- | -- | -- | -- | -- | -- | -- | -- |
|
ROC
|
-- | -- | -- | -- | -- | -- | -- | -- | -- | -- | -- | -- |
|
Other
|
-- | -- | -- | -- | -- | -- | -- | -- | -- | -- | -- | -- |
|
Total
|
-- | -- | -- | -- | -- | -- | -- | -- | -- | -- | -- | -- |
As of June 30, 2026.
Basic Info
| Investment Strategy | |
| The Fund seeks long-term growth of capital by investing in both large and small capitalization companies domiciled, or with primary operations, in Asia, excluding Japan. |
| General | |
| Security Type | Mutual Fund |
| Equity Style | Large Cap Growth |
| Broad Asset Class | International Equity |
| Broad Category | Equity |
| Global Peer Group | Equity Asia Pacific ex Japan |
| Peer Group | Pacific Ex Japan Funds |
| Global Macro | Equity Asia Pacific |
| US Macro | Developed International Markets Funds |
| YCharts Categorization | -- |
| YCharts Benchmark | -- |
| Prospectus Objective | Pacific Ex Japan Funds |
| Fund Owner Firm Name | T. Rowe Price |
| Broad Asset Class Benchmark Index | |
| ^MSACXUSNTR | 100.0% |
Fundamentals
| General | |
| Distribution Yield | -- |
| Dividend Yield TTM (7-21-26) | 0.51% |
| 30-Day SEC Yield | -- |
| 7-Day SEC Yield | -- |
| Number of Holdings | 70 |
| Stock | |
| Weighted Average PE Ratio | 25.48 |
| Weighted Average Price to Sales Ratio | 5.878 |
| Weighted Average Price to Book Ratio | 5.066 |
| Weighted Median ROE | 20.88% |
| Weighted Median ROA | 11.96% |
| Return on Investment (TTM) | 17.64% |
| Earning Yield | 0.0524 |
| LT Debt / Shareholders Equity | 0.2747 |
| Number of Equity Holdings | 68 |
As of March 31, 2026
Growth Metrics
| EPS Growth (1Y) | 37.19% |
| EPS Growth (3Y) | 24.31% |
| EPS Growth (5Y) | 21.38% |
| Sales Growth (1Y) | 18.10% |
| Sales Growth (3Y) | 14.06% |
| Sales Growth (5Y) | 14.93% |
| Sales per Share Growth (1Y) | 18.27% |
| Sales per Share Growth (3Y) | 14.13% |
| Operating Cash Flow - Growth Rate (3Y) | 19.81% |
As of March 31, 2026
Fund Details
Top Portfolio Holders
| Name | % Weight |
|---|---|
| Portfolio A | 5.00% |
| Portfolio B | 3.50% |
| Portfolio C | 2.25% |
Excel Add-In Codes
| Name: =YCI("M:PRASX", "name") |
| Broad Asset Class: =YCI("M:PRASX", "broad_asset_class") |
| Broad Category: =YCI("M:PRASX", "broad_category_group") |
| Prospectus Objective: =YCI("M:PRASX", "prospectus_objective") |
| To find the codes for any of our securities and financial metrics, see our Complete Excel Reference. |