

PIMCO Inflation Response Multi-Asset Fund I-2 (PPRMX)
9.89
-0.03
(-0.30%)
USD |
May 27 2026
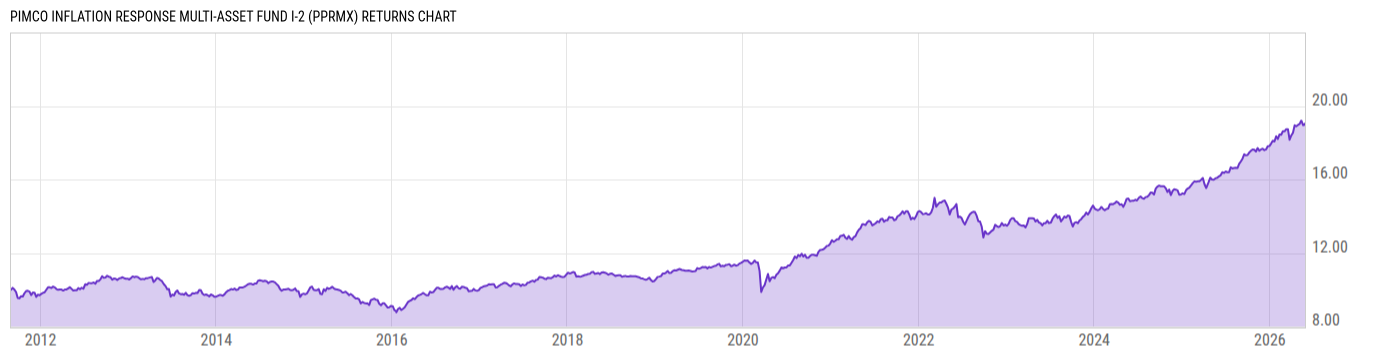
Returns Chart
Key Stats
| Net Expense Ratio | Total Assets Under Management | Weighted Average Dividend Yield | Turnover Ratio (Generic) |
|---|---|---|---|
| 2.01% | 2.355B | -- | 322.0% |
| 1 Year Fund Level Flows | 1 Year Total Returns (Daily) | Annualized Total Returns Since Inception (Daily) | Max Drawdown (Since Inception) |
| 187.91M | 17.85% |
Basic Info
| Investment Strategy | |
| The Fund seeks total return which exceeds that of its benchmark. The Fund seeks to achieve its investment objective by investing under normal circumstances in a combination of Fixed Income Instruments of varying maturities. The Fund may also invest up to 25% of its total assets in equity-related investments. |
| General | |
| Security Type | Mutual Fund |
| Equity Style | -- |
| Broad Asset Class | Allocation |
| Broad Category | Allocation |
| Global Peer Group | Mixed Asset USD Flexible - Global |
| Peer Group | Flexible Portfolio Funds |
| Global Macro | Mixed Asset HC Flexible |
| US Macro | Mixed-Assets Funds |
| YCharts Categorization | -- |
| YCharts Benchmark | -- |
| Prospectus Objective | Flexible Portfolio Funds |
| Fund Owner Firm Name | PIMCO |
| Broad Asset Class Benchmark Index | |
| ^SPXTR | 100.0% |
Net Fund Flows Versus Peer Group
1 Month
% Rank:
10
-159.25M
Peer Group Low
7.334B
Peer Group High
1 Year
% Rank:
11
187.91M
-3.214B
Peer Group Low
7.334B
Peer Group High
3 Months
% Rank:
10
-582.29M
Peer Group Low
7.334B
Peer Group High
3 Years
% Rank:
69
-12.12B
Peer Group Low
7.334B
Peer Group High
6 Months
% Rank:
11
-1.396B
Peer Group Low
7.334B
Peer Group High
5 Years
% Rank:
10
-14.74B
Peer Group Low
7.334B
Peer Group High
YTD
% Rank:
10
-927.39M
Peer Group Low
7.334B
Peer Group High
10 Years
% Rank:
14
-47.38B
Peer Group Low
9.619B
Peer Group High
Date Unavailable
Risk
Performance Versus Peer Group
Annual Total Returns Versus Peers
As of May 28, 2026.
Asset Allocation
As of December 31, 2025.
| Type | % Net |
|---|---|
| Cash | -33.63% |
| Stock | 4.31% |
| Bond | 100.4% |
| Convertible | 0.00% |
| Preferred | 0.00% |
| Other | 28.89% |
Top 10 Holdings
| Name | % Weight | Price | % Change |
|---|---|---|---|
|
Bofa Securities Inc Repo
|
14.61% | -- | -- |
|
Gold Warehouse Receipts Commodity Future
|
14.12% | -- | -- |
|
Federal National Mortgage Association 4.5% 01-FEB-2056
|
12.10% | -- | -- |
| SOCIETE GENERALE SOCGEN 01/05/2026 FIX USD Corporate (Matured) | 7.11% | -- | -- |
| PIMCO EM Currency and Sh-Tr Inv Fund Institutional | 6.35% | 7.69 | 0.13% |
| United States of America USGB 0.125 07/15/2031 FIX USD Government | 5.71% | 92.96 | 0.06% |
| United States of America USGB 1.875 07/15/2035 FIX USD Government | 4.74% | 99.08 | 0.07% |
| PIMCO Commodity Strategy Active ETF | 3.89% | 33.69 | 0.78% |
| United States of America USGB 1.625 10/15/2029 FIX USD Government | 3.86% | 100.74 | 0.02% |
|
Federal Home Loan Mortgage Corp 01-AUG-2054 RJ2702
|
3.77% | -- | -- |
Fees & Availability
| Fees | |
| Actual 12B-1 Fee | -- |
| Actual Management Fee | 0.53% |
| Administration Fee | 212.9K% |
| Maximum Front Load | -- |
| Maximum Deferred Load | -- |
| Maximum Redemption Fee | -- |
| General Availability | |
| Available for Insurance Product | No |
| Available for RRSP | No |
| Purchase Details | |
| Open to New Investors |
|
| Minimum Initial Investment | 1.00M None |
| Minimum Subsequent Investment | 0.00 None |
Basic Info
| Investment Strategy | |
| The Fund seeks total return which exceeds that of its benchmark. The Fund seeks to achieve its investment objective by investing under normal circumstances in a combination of Fixed Income Instruments of varying maturities. The Fund may also invest up to 25% of its total assets in equity-related investments. |
| General | |
| Security Type | Mutual Fund |
| Equity Style | -- |
| Broad Asset Class | Allocation |
| Broad Category | Allocation |
| Global Peer Group | Mixed Asset USD Flexible - Global |
| Peer Group | Flexible Portfolio Funds |
| Global Macro | Mixed Asset HC Flexible |
| US Macro | Mixed-Assets Funds |
| YCharts Categorization | -- |
| YCharts Benchmark | -- |
| Prospectus Objective | Flexible Portfolio Funds |
| Fund Owner Firm Name | PIMCO |
| Broad Asset Class Benchmark Index | |
| ^SPXTR | 100.0% |
Fundamentals
| General | |
| Distribution Yield | -- |
| Dividend Yield TTM (5-26-26) | 2.42% |
| 30-Day SEC Yield (4-30-26) | 5.38% |
| 7-Day SEC Yield | -- |
| Number of Holdings | 552 |
| Bond | |
| Yield to Maturity (12-31-25) | 3.09% |
| Effective Duration | 3.03 |
| Average Coupon | 2.59% |
| Calculated Average Quality | 2.071 |
| Effective Maturity | 13.11 |
| Nominal Maturity | 13.24 |
| Number of Bond Holdings | 258 |
As of December 31, 2025
Fund Details
Top Portfolio Holders
| Name | % Weight |
|---|---|
| Portfolio A | 5.00% |
| Portfolio B | 3.50% |
| Portfolio C | 2.25% |
Excel Add-In Codes
| Name: =YCI("M:PPRMX", "name") |
| Broad Asset Class: =YCI("M:PPRMX", "broad_asset_class") |
| Broad Category: =YCI("M:PPRMX", "broad_category_group") |
| Prospectus Objective: =YCI("M:PPRMX", "prospectus_objective") |
| To find the codes for any of our securities and financial metrics, see our Complete Excel Reference. |