

Putnam Income Fund M (PNCMX)
4.82
+0.01
(+0.21%)
USD |
Jun 09 2026
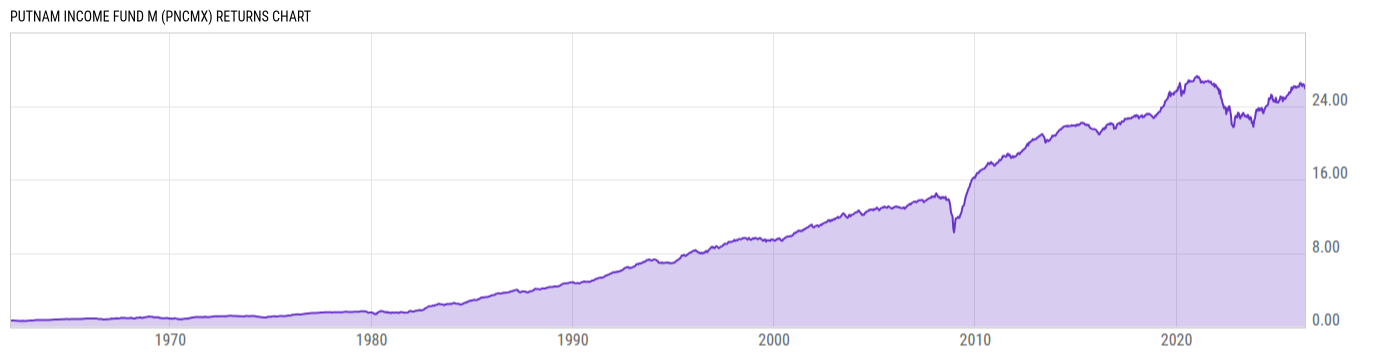
Returns Chart
Key Stats
| Net Expense Ratio | Total Assets Under Management | Weighted Average Dividend Yield | Turnover Ratio (Generic) |
|---|---|---|---|
| 0.98% | 989.49M | -- | 431.0% |
| 1 Year Fund Level Flows | 1 Year Total Returns (Daily) | Annualized Total Returns Since Inception (Daily) | Max Drawdown (Since Inception) |
| -92.67M | 5.27% |
Basic Info
| Investment Strategy | |
| The Fund seeks high current income consistent with prudent risk. The Fund invests mainly in bonds that are securitized debt instruments and other obligations of companies and governments worldwide denominated in U.S. dollars; and have intermediate- to long-term maturities (three years or longer). |
| General | |
| Security Type | Mutual Fund |
| Equity Style | -- |
| Broad Asset Class | Taxable Bond |
| Broad Category | Fixed Income |
| Global Peer Group | Bond USD Medium Term |
| Peer Group | Core Bond Funds |
| Global Macro | Bond HC |
| US Macro | Short/Intermediate Investment-Grade Funds |
| YCharts Categorization | -- |
| YCharts Benchmark | -- |
| Prospectus Objective | Core Bond Funds |
| Fund Owner Firm Name | Franklin Templeton |
| Broad Asset Class Benchmark Index | |
| ^BBUSATR | 100.0% |
Net Fund Flows Versus Peer Group
1 Month
% Rank:
67
-1.041B
Peer Group Low
10.20B
Peer Group High
1 Year
% Rank:
76
-92.67M
-5.263B
Peer Group Low
60.69B
Peer Group High
3 Months
% Rank:
66
-2.855B
Peer Group Low
12.30B
Peer Group High
3 Years
% Rank:
87
-14.12B
Peer Group Low
100.30B
Peer Group High
6 Months
% Rank:
72
-5.233B
Peer Group Low
34.54B
Peer Group High
5 Years
% Rank:
96
-16.57B
Peer Group Low
124.48B
Peer Group High
YTD
% Rank:
72
-5.213B
Peer Group Low
30.75B
Peer Group High
10 Years
% Rank:
89
-15.49B
Peer Group Low
254.64B
Peer Group High
Date Unavailable
Risk
Performance Versus Peer Group
Annual Total Returns Versus Peers
As of June 10, 2026.
Asset Allocation
As of April 30, 2026.
| Type | % Net |
|---|---|
| Cash | -48.06% |
| Stock | 0.04% |
| Bond | 92.64% |
| Convertible | 0.00% |
| Preferred | 0.00% |
| Other | 55.39% |
Top 10 Holdings
| Name | % Weight | Price | % Change |
|---|---|---|---|
|
5YR T NOTE JUN26
|
12.57% | -- | -- |
|
10YR UL TN JUN26
|
5.84% | -- | -- |
|
Federal National Mortgage Association 2% 01-MAY-2056
|
5.16% | -- | -- |
|
10Y TNotes JUN26
|
4.41% | -- | -- |
|
ULTRA BOND JUN26
|
3.90% | -- | -- |
|
Federal National Mortgage Association 2.5% 01-MAY-2056
|
3.82% | -- | -- |
|
Government National Mortgage Association 2 5.5% 01-MAY-2056
|
3.80% | -- | -- |
| FNMA-New 6.0 05/15/2036 FIX USD Agency | 2.68% | 102.24 | -0.02% |
| FEDERAL NATIONAL MORTGAGE ASSOCIATION FNMA-New 05/15/2035 FIX USD Agency | 2.68% | 96.43 | -0.12% |
| Franklin Ultra Short Bond ETF | 2.55% | 24.94 | 0.02% |
Fees & Availability
| Fees | |
| Actual 12B-1 Fee | 0.50% |
| Actual Management Fee | 0.26% |
| Administration Fee | -- |
| Maximum Front Load | 3.25% |
| Maximum Deferred Load | -- |
| Maximum Redemption Fee | 0.00% |
| General Availability | |
| Available for Insurance Product | No |
| Available for RRSP | No |
| Purchase Details | |
| Open to New Investors |
|
| Minimum Initial Investment | 500.00 None |
| Minimum Subsequent Investment | 0.00 None |
Basic Info
| Investment Strategy | |
| The Fund seeks high current income consistent with prudent risk. The Fund invests mainly in bonds that are securitized debt instruments and other obligations of companies and governments worldwide denominated in U.S. dollars; and have intermediate- to long-term maturities (three years or longer). |
| General | |
| Security Type | Mutual Fund |
| Equity Style | -- |
| Broad Asset Class | Taxable Bond |
| Broad Category | Fixed Income |
| Global Peer Group | Bond USD Medium Term |
| Peer Group | Core Bond Funds |
| Global Macro | Bond HC |
| US Macro | Short/Intermediate Investment-Grade Funds |
| YCharts Categorization | -- |
| YCharts Benchmark | -- |
| Prospectus Objective | Core Bond Funds |
| Fund Owner Firm Name | Franklin Templeton |
| Broad Asset Class Benchmark Index | |
| ^BBUSATR | 100.0% |
Fundamentals
| General | |
| Distribution Yield | -- |
| Dividend Yield TTM (6-8-26) | 4.56% |
| 30-Day SEC Yield (4-30-26) | 3.85% |
| 7-Day SEC Yield | -- |
| Number of Holdings | 1212 |
Fund Details
| Key Dates | |
| Inception Date | 12/31/1993 |
| Last Annual Report Date | 10/31/2025 |
| Last Prospectus Date | 3/1/2026 |
| Share Classes | |
| PIFRX | Retirement |
| PINCX | A |
| PINFX | Retirement |
| PINHX | Retirement |
| PNCYX | Inst |
| PUICX | C |
| Attributes | |
| Index Fund | -- |
| Inverse Fund | No |
| Leveraged Fund | -- |
| Fund of Funds | No |
| Currency Hedged Fund | -- |
| Socially Responsible Fund | No |
Top Portfolio Holders
| Name | % Weight |
|---|---|
| Portfolio A | 5.00% |
| Portfolio B | 3.50% |
| Portfolio C | 2.25% |
Excel Add-In Codes
| Name: =YCI("M:PNCMX", "name") |
| Broad Asset Class: =YCI("M:PNCMX", "broad_asset_class") |
| Broad Category: =YCI("M:PNCMX", "broad_category_group") |
| Prospectus Objective: =YCI("M:PNCMX", "prospectus_objective") |
| To find the codes for any of our securities and financial metrics, see our Complete Excel Reference. |