

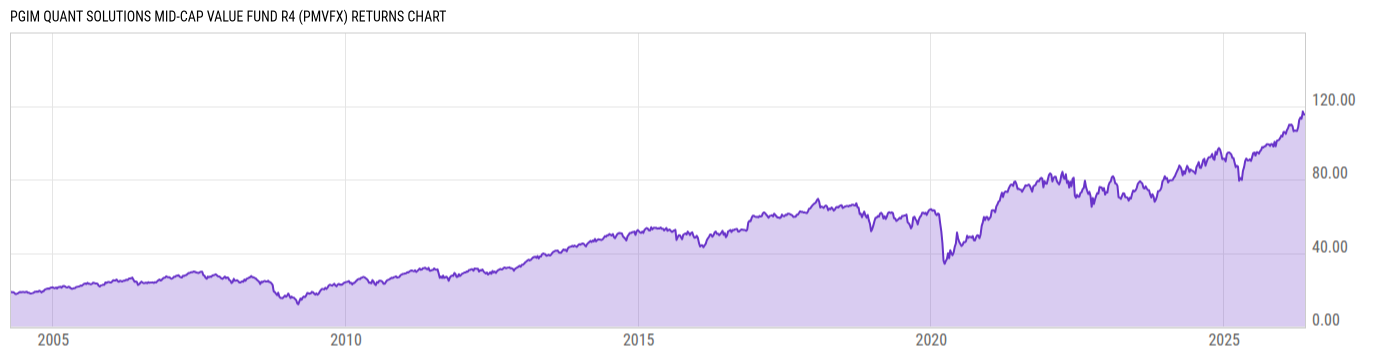
PGIM Quant Solutions Mid-Cap Value Fund R4 (PMVFX)
31.81
+0.24
(+0.76%)
USD |
Jun 09 2026
Returns Chart
Key Stats
| Net Expense Ratio | Total Assets Under Management | Weighted Average Dividend Yield | Turnover Ratio (Generic) |
|---|---|---|---|
| 0.98% | 185.06M | 1.42% | 111.0% |
| 1 Year Fund Level Flows | 1 Year Total Returns (Daily) | Annualized Total Returns Since Inception (Daily) | Max Drawdown (Since Inception) |
| -19.55M | 30.86% |
Basic Info
| Investment Strategy | |
| The Fund seeks capital growth by investing at least 80% of its assets in medium capitalization companies. Under the Fund's value-oriented investment approach, the Sub-advisor looks for well-managed companies whose stock prices are undervalued and that may rise in price when other investors realize their worth. |
| General | |
| Security Type | Mutual Fund |
| Equity Style | Mid Cap Core |
| Broad Asset Class | US Equity |
| Broad Category | Equity |
| Global Peer Group | Equity US Sm&Mid Cap |
| Peer Group | Mid-Cap Value Funds |
| Global Macro | Equity North America |
| US Macro | Mid-Cap Funds |
| YCharts Categorization | -- |
| YCharts Benchmark | -- |
| Prospectus Objective | Mid-Cap Funds |
| Fund Owner Firm Name | PGIM |
| Broad Asset Class Benchmark Index | |
| ^SPXTR | 100.0% |
Net Fund Flows Versus Peer Group
1 Month
% Rank:
35
-391.34M
Peer Group Low
324.38M
Peer Group High
1 Year
% Rank:
32
-19.55M
-3.208B
Peer Group Low
1.675B
Peer Group High
3 Months
% Rank:
35
-736.33M
Peer Group Low
1.054B
Peer Group High
3 Years
% Rank:
37
-13.16B
Peer Group Low
2.323B
Peer Group High
6 Months
% Rank:
31
-1.684B
Peer Group Low
1.395B
Peer Group High
5 Years
% Rank:
48
-19.04B
Peer Group Low
2.497B
Peer Group High
YTD
% Rank:
36
-1.134B
Peer Group Low
1.304B
Peer Group High
10 Years
% Rank:
68
-45.09B
Peer Group Low
5.968B
Peer Group High
Date Unavailable
Risk
Performance Versus Peer Group
Annual Total Returns Versus Peers
As of June 11, 2026.
Asset Allocation
As of April 30, 2026.
| Type | % Net |
|---|---|
| Cash | 0.12% |
| Stock | 99.80% |
| Bond | 0.00% |
| Convertible | 0.00% |
| Preferred | 0.00% |
| Other | 0.08% |
Top 10 Holdings
| Name | % Weight | Price | % Change |
|---|---|---|---|
| Western Digital Corp. | 2.15% | 490.09 | -5.34% |
| Sandisk Corp. | 1.71% | 1643.23 | -0.20% |
| The Bank of New York Mellon Corp. | 1.40% | 139.75 | -2.44% |
| Ross Stores, Inc. | 1.15% | 231.92 | 1.08% |
| Nucor Corp. | 1.15% | 250.49 | -1.51% |
| Flex Ltd. | 1.08% | 139.49 | -5.24% |
| The Allstate Corp. | 1.07% | 223.34 | 2.84% |
| Exelon Corp. | 1.06% | 45.61 | 0.62% |
| Northern Trust Corp. | 1.04% | 166.13 | -2.62% |
| AMETEK, Inc. | 1.01% | 221.78 | -3.49% |
Fees & Availability
| Fees | |
| Actual 12B-1 Fee | -- |
| Actual Management Fee | 0.32% |
| Administration Fee | -- |
| Maximum Front Load | -- |
| Maximum Deferred Load | -- |
| Maximum Redemption Fee | -- |
| General Availability | |
| Available for Insurance Product | No |
| Available for RRSP | No |
| Purchase Details | |
| Open to New Investors |
|
| Minimum Initial Investment | 0.00 None |
| Minimum Subsequent Investment | 0.00 None |
Basic Info
| Investment Strategy | |
| The Fund seeks capital growth by investing at least 80% of its assets in medium capitalization companies. Under the Fund's value-oriented investment approach, the Sub-advisor looks for well-managed companies whose stock prices are undervalued and that may rise in price when other investors realize their worth. |
| General | |
| Security Type | Mutual Fund |
| Equity Style | Mid Cap Core |
| Broad Asset Class | US Equity |
| Broad Category | Equity |
| Global Peer Group | Equity US Sm&Mid Cap |
| Peer Group | Mid-Cap Value Funds |
| Global Macro | Equity North America |
| US Macro | Mid-Cap Funds |
| YCharts Categorization | -- |
| YCharts Benchmark | -- |
| Prospectus Objective | Mid-Cap Funds |
| Fund Owner Firm Name | PGIM |
| Broad Asset Class Benchmark Index | |
| ^SPXTR | 100.0% |
Fundamentals
| General | |
| Distribution Yield | -- |
| Dividend Yield TTM (6-8-26) | 1.08% |
| 30-Day SEC Yield | -- |
| 7-Day SEC Yield | -- |
| Number of Holdings | 257 |
| Stock | |
| Weighted Average PE Ratio | 23.09 |
| Weighted Average Price to Sales Ratio | 3.153 |
| Weighted Average Price to Book Ratio | 5.066 |
| Weighted Median ROE | 79.01% |
| Weighted Median ROA | 9.02% |
| ROI (TTM) | 16.55% |
| Return on Investment (TTM) | 16.55% |
| Earning Yield | 0.0617 |
| LT Debt / Shareholders Equity | 1.220 |
| Number of Equity Holdings | 253 |
As of April 30, 2026
Growth Metrics
| EPS Growth (1Y) | 23.00% |
| EPS Growth (3Y) | 11.38% |
| EPS Growth (5Y) | 15.60% |
| Sales Growth (1Y) | 7.05% |
| Sales Growth (3Y) | 3.55% |
| Sales Growth (5Y) | 9.66% |
| Sales per Share Growth (1Y) | 8.42% |
| Sales per Share Growth (3Y) | 4.85% |
| Operating Cash Flow - Growth Rate (3Y) | 11.70% |
As of April 30, 2026
Fund Details
| Key Dates | |
| Inception Date | 4/12/2004 |
| Last Annual Report Date | 10/31/2025 |
| Last Prospectus Date | 12/30/2025 |
| Share Classes | |
| NCBVX | C |
| PMVEX | Retirement |
| PMVQX | Retirement |
| SDVRX | Retirement |
| SPRAX | A |
| SPVZX | Z |
| Attributes | |
| Index Fund | -- |
| Inverse Fund | No |
| Leveraged Fund | -- |
| Fund of Funds | No |
| Currency Hedged Fund | -- |
| Socially Responsible Fund | No |
Top Portfolio Holders
| Name | % Weight |
|---|---|
| Portfolio A | 5.00% |
| Portfolio B | 3.50% |
| Portfolio C | 2.25% |
Excel Add-In Codes
| Name: =YCI("M:PMVFX", "name") |
| Broad Asset Class: =YCI("M:PMVFX", "broad_asset_class") |
| Broad Category: =YCI("M:PMVFX", "broad_category_group") |
| Prospectus Objective: =YCI("M:PMVFX", "prospectus_objective") |
| To find the codes for any of our securities and financial metrics, see our Complete Excel Reference. |