

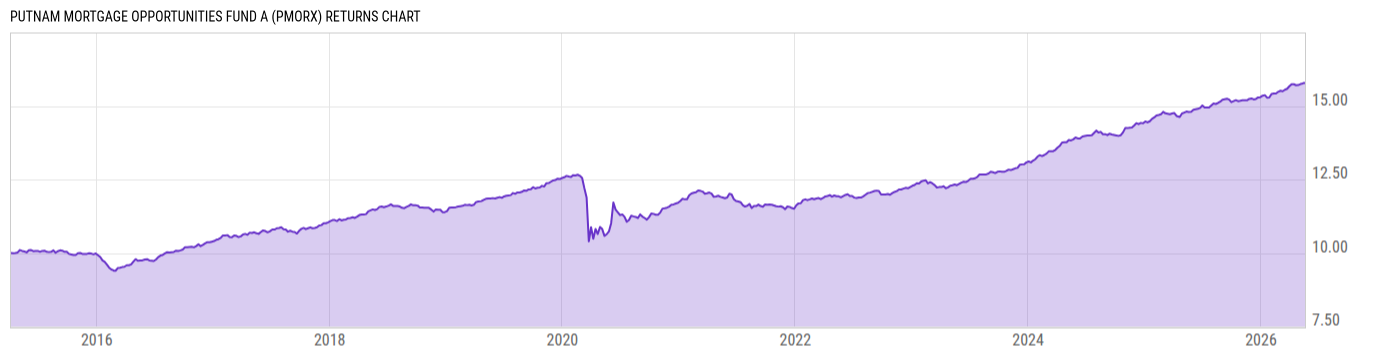
Putnam Mortgage Opportunities Fund A (PMORX)
9.14
-0.01
(-0.11%)
USD |
Jun 09 2026
Returns Chart
Key Stats
| Net Expense Ratio | Total Assets Under Management | Weighted Average Dividend Yield | Turnover Ratio (Generic) |
|---|---|---|---|
| 0.85% | 448.76M | -- | 966.0% |
| 1 Year Fund Level Flows | 1 Year Total Returns (Daily) | Annualized Total Returns Since Inception (Daily) | Max Drawdown (Since Inception) |
| -158.96M | 7.55% |
Basic Info
| Investment Strategy | |
| The Fund seeks to maximize total return consistent with what Putnam Investment Management, LLC believes to be prudent risk. The Fund will invest mainly in mortgage-related fixed income securities bonds and related derivatives that are either investment-grade or below-investment-grade in quality. |
| General | |
| Security Type | Mutual Fund |
| Equity Style | -- |
| Broad Asset Class | Alternative |
| Broad Category | Alternative Strategies |
| Global Peer Group | Absolute Return USD Low |
| Peer Group | Absolute Return Funds |
| Global Macro | Absolute Return |
| US Macro | Alternative Equity Funds |
| YCharts Categorization | -- |
| YCharts Benchmark | -- |
| Prospectus Objective | Absolute Return Funds |
| Fund Owner Firm Name | Franklin Templeton |
| Broad Asset Class Benchmark Index | |
| ^MSACWINTR | 100.0% |
Net Fund Flows Versus Peer Group
1 Month
% Rank:
74
-68.03M
Peer Group Low
52.92M
Peer Group High
1 Year
% Rank:
92
-158.96M
-169.48M
Peer Group Low
717.90M
Peer Group High
3 Months
% Rank:
25
-77.17M
Peer Group Low
300.39M
Peer Group High
3 Years
% Rank:
53
-1.988B
Peer Group Low
1.412B
Peer Group High
6 Months
% Rank:
33
-73.27M
Peer Group Low
418.42M
Peer Group High
5 Years
% Rank:
23
-2.626B
Peer Group Low
1.282B
Peer Group High
YTD
% Rank:
28
-57.70M
Peer Group Low
385.57M
Peer Group High
10 Years
% Rank:
25
-8.918B
Peer Group Low
3.228B
Peer Group High
Date Unavailable
Risk
Performance Versus Peer Group
Annual Total Returns Versus Peers
As of June 10, 2026.
Asset Allocation
As of April 30, 2026.
| Type | % Net |
|---|---|
| Cash | 67.62% |
| Stock | 0.00% |
| Bond | 77.56% |
| Convertible | 0.00% |
| Preferred | 0.00% |
| Other | -45.18% |
Top 10 Holdings
| Name | % Weight | Price | % Change |
|---|---|---|---|
|
CASH AND CASH EQUIVALENTS
|
67.62% | -- | -- |
|
FEDERAL NATIONAL MORTGAGE ASSOCIATION 5.5% 01-MAY-2056
|
24.74% | -- | -- |
| FNMA-New 6.0 05/15/2036 FIX USD Agency | 10.78% | 102.24 | -0.02% |
| FEDERAL NATIONAL MORTGAGE ASSOCIATION FNMA-New 05/15/2035 FIX USD Agency | 6.50% | 96.43 | -0.12% |
|
FEDERAL NATIONAL MORTGAGE ASSOCIATION 5% 01-MAY-2056
|
6.04% | -- | -- |
|
GOVERNMENT NATIONAL MORTGAGE ASSOCIATION 2 6% 01-MAY-2056
|
2.80% | -- | -- |
|
FEDERAL NATIONAL MORTGAGE ASSOCIATION 3% 01-MAY-2056
|
1.11% | -- | -- |
|
FREDDIE MAC STACR REMIC TRUST 19FTR1 B2 FLT 12.10964% 27-JAN-2048
|
0.97% | -- | -- |
|
FREDDIE MAC STACR REMIC TRUST 18HQA2 B2 FLT 14.75964% 25-OCT-2048
|
0.78% | -- | -- |
|
CASCADE FUNDING MORTGAGE TRUST 24HB13 M1 FIX 3% 25-MAY-2034
|
0.77% | -- | -- |
Fees & Availability
| Fees | |
| Actual 12B-1 Fee | 0.25% |
| Actual Management Fee | 0.39% |
| Administration Fee | -- |
| Maximum Front Load | 4.00% |
| Maximum Deferred Load | -- |
| Maximum Redemption Fee | -- |
| General Availability | |
| Available for Insurance Product | No |
| Available for RRSP | No |
| Purchase Details | |
| Open to New Investors |
|
| Minimum Initial Investment | 500.00 None |
| Minimum Subsequent Investment | 0.00 None |
Basic Info
| Investment Strategy | |
| The Fund seeks to maximize total return consistent with what Putnam Investment Management, LLC believes to be prudent risk. The Fund will invest mainly in mortgage-related fixed income securities bonds and related derivatives that are either investment-grade or below-investment-grade in quality. |
| General | |
| Security Type | Mutual Fund |
| Equity Style | -- |
| Broad Asset Class | Alternative |
| Broad Category | Alternative Strategies |
| Global Peer Group | Absolute Return USD Low |
| Peer Group | Absolute Return Funds |
| Global Macro | Absolute Return |
| US Macro | Alternative Equity Funds |
| YCharts Categorization | -- |
| YCharts Benchmark | -- |
| Prospectus Objective | Absolute Return Funds |
| Fund Owner Firm Name | Franklin Templeton |
| Broad Asset Class Benchmark Index | |
| ^MSACWINTR | 100.0% |
Fundamentals
| General | |
| Distribution Yield | -- |
| Dividend Yield TTM (6-8-26) | 4.73% |
| 30-Day SEC Yield (11-30-25) | 4.67% |
| 7-Day SEC Yield | -- |
| Number of Holdings | 10 |
Fund Details
Top Portfolio Holders
| Name | % Weight |
|---|---|
| Portfolio A | 5.00% |
| Portfolio B | 3.50% |
| Portfolio C | 2.25% |
Excel Add-In Codes
| Name: =YCI("M:PMORX", "name") |
| Broad Asset Class: =YCI("M:PMORX", "broad_asset_class") |
| Broad Category: =YCI("M:PMORX", "broad_category_group") |
| Prospectus Objective: =YCI("M:PMORX", "prospectus_objective") |
| To find the codes for any of our securities and financial metrics, see our Complete Excel Reference. |