

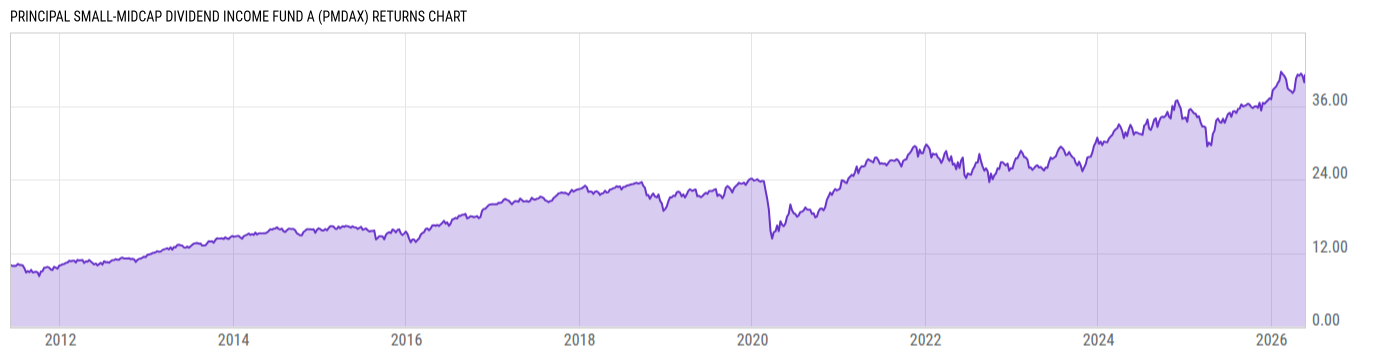
Principal Small-MidCap Dividend Income Fund A (PMDAX)
21.49
+0.07
(+0.33%)
USD |
May 21 2026
Returns Chart
Key Stats
| Net Expense Ratio | Total Assets Under Management | Weighted Average Dividend Yield | Turnover Ratio (Generic) |
|---|---|---|---|
| 1.12% | 1.521B | 2.07% | 26.00% |
| 1 Year Fund Level Flows | 1 Year Total Returns (Daily) | Annualized Total Returns Since Inception (Daily) | Max Drawdown (Since Inception) |
| -426.49M | 23.76% |
Basic Info
| Investment Strategy | |
| The Fund seeks to provide a relatively high level of current income and long-term growth of income and capital. The Fund invests at least 80% of its net assets in dividend-paying equity securities of companies with small to medium market capitalizations at the time of purchase. |
| General | |
| Security Type | Mutual Fund |
| Equity Style | Small Cap Core |
| Broad Asset Class | US Equity |
| Broad Category | Equity |
| Global Peer Group | Equity US Income |
| Peer Group | Equity Income Funds |
| Global Macro | Equity North America |
| US Macro | Equity Income Funds |
| YCharts Categorization | -- |
| YCharts Benchmark | -- |
| Prospectus Objective | Equity Income Funds |
| Fund Owner Firm Name | Principal |
| Broad Asset Class Benchmark Index | |
| ^SPXTR | 100.0% |
Net Fund Flows Versus Peer Group
1 Month
% Rank:
80
-956.59M
Peer Group Low
2.361B
Peer Group High
1 Year
% Rank:
77
-426.49M
-12.14B
Peer Group Low
11.75B
Peer Group High
3 Months
% Rank:
88
-2.688B
Peer Group Low
5.885B
Peer Group High
3 Years
% Rank:
59
-24.83B
Peer Group Low
22.66B
Peer Group High
6 Months
% Rank:
84
-7.334B
Peer Group Low
6.424B
Peer Group High
5 Years
% Rank:
47
-26.84B
Peer Group Low
41.05B
Peer Group High
YTD
% Rank:
86
-3.331B
Peer Group Low
6.434B
Peer Group High
10 Years
% Rank:
67
-28.72B
Peer Group Low
52.80B
Peer Group High
Date Unavailable
Risk
Performance Versus Peer Group
Annual Total Returns Versus Peers
As of May 22, 2026.
Asset Allocation
As of March 31, 2026.
| Type | % Net |
|---|---|
| Cash | 0.38% |
| Stock | 98.93% |
| Bond | 0.67% |
| Convertible | 0.00% |
| Preferred | 0.00% |
| Other | 0.02% |
Top 10 Holdings
| Name | % Weight | Price | % Change |
|---|---|---|---|
| MKS, Inc. | 3.38% | 313.34 | 0.59% |
| Amkor Technology, Inc. | 3.14% | 65.90 | -3.78% |
| East West Bancorp, Inc. | 2.78% | 122.99 | -0.24% |
| nVent Electric Plc | 2.39% | 163.51 | 1.02% |
| Wintrust Financial Corp. | 2.34% | 149.68 | -0.09% |
| Packaging Corporation of America | 2.11% | 213.75 | 0.25% |
| Quest Diagnostics, Inc. | 2.09% | 193.68 | -0.04% |
| Cullen/Frost Bankers, Inc. | 2.03% | 139.05 | -0.50% |
| Comfort Systems USA, Inc. | 2.02% | 1834.71 | -0.04% |
| STERIS Plc (Ireland) | 2.00% | 219.60 | 1.68% |
Fees & Availability
| Fees | |
| Actual 12B-1 Fee | 0.25% |
| Actual Management Fee | 0.75% |
| Administration Fee | -- |
| Maximum Front Load | 5.50% |
| Maximum Deferred Load | -- |
| Maximum Redemption Fee | -- |
| General Availability | |
| Available for Insurance Product | No |
| Available for RRSP | No |
| Purchase Details | |
| Open to New Investors |
|
| Minimum Initial Investment | 1000.00 None |
| Minimum Subsequent Investment | 100.00 None |
Basic Info
| Investment Strategy | |
| The Fund seeks to provide a relatively high level of current income and long-term growth of income and capital. The Fund invests at least 80% of its net assets in dividend-paying equity securities of companies with small to medium market capitalizations at the time of purchase. |
| General | |
| Security Type | Mutual Fund |
| Equity Style | Small Cap Core |
| Broad Asset Class | US Equity |
| Broad Category | Equity |
| Global Peer Group | Equity US Income |
| Peer Group | Equity Income Funds |
| Global Macro | Equity North America |
| US Macro | Equity Income Funds |
| YCharts Categorization | -- |
| YCharts Benchmark | -- |
| Prospectus Objective | Equity Income Funds |
| Fund Owner Firm Name | Principal |
| Broad Asset Class Benchmark Index | |
| ^SPXTR | 100.0% |
Fundamentals
| General | |
| Distribution Yield | -- |
| Dividend Yield TTM (5-20-26) | 1.02% |
| 30-Day SEC Yield (4-30-26) | 0.87% |
| 7-Day SEC Yield | -- |
| Number of Holdings | 77 |
| Stock | |
| Weighted Average PE Ratio | 25.43 |
| Weighted Average Price to Sales Ratio | 3.758 |
| Weighted Average Price to Book Ratio | 4.537 |
| Weighted Median ROE | 20.45% |
| Weighted Median ROA | 6.45% |
| ROI (TTM) | 10.06% |
| Return on Investment (TTM) | 10.06% |
| Earning Yield | 0.0491 |
| LT Debt / Shareholders Equity | 1.206 |
| Number of Equity Holdings | 74 |
As of March 31, 2026
Growth Metrics
| EPS Growth (1Y) | 13.23% |
| EPS Growth (3Y) | 3.60% |
| EPS Growth (5Y) | 11.85% |
| Sales Growth (1Y) | 8.47% |
| Sales Growth (3Y) | 5.38% |
| Sales Growth (5Y) | 10.58% |
| Sales per Share Growth (1Y) | 9.32% |
| Sales per Share Growth (3Y) | 5.46% |
| Operating Cash Flow - Growth Rate (3Y) | 14.33% |
As of March 31, 2026
Fund Details
Top Portfolio Holders
| Name | % Weight |
|---|---|
| Portfolio A | 5.00% |
| Portfolio B | 3.50% |
| Portfolio C | 2.25% |
Excel Add-In Codes
| Name: =YCI("M:PMDAX", "name") |
| Broad Asset Class: =YCI("M:PMDAX", "broad_asset_class") |
| Broad Category: =YCI("M:PMDAX", "broad_category_group") |
| Prospectus Objective: =YCI("M:PMDAX", "prospectus_objective") |
| To find the codes for any of our securities and financial metrics, see our Complete Excel Reference. |