

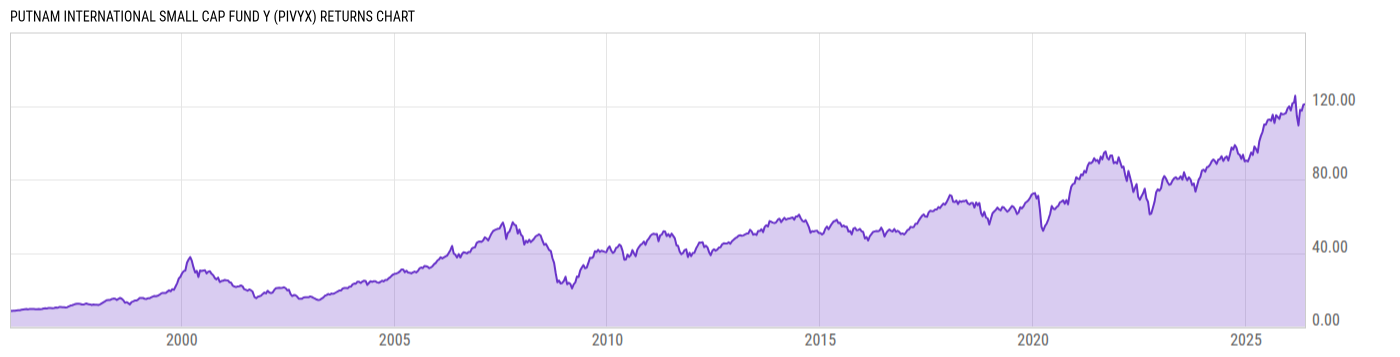
Putnam International Small Cap Fund Y (PIVYX)
45.91
+0.12
(+0.26%)
USD |
May 22 2026
Returns Chart
Key Stats
| Net Expense Ratio | Total Assets Under Management | Weighted Average Dividend Yield | Turnover Ratio (Generic) |
|---|---|---|---|
| 1.05% | 341.09M | 2.53% | -- |
| 1 Year Fund Level Flows | 1 Year Total Returns (Daily) | Annualized Total Returns Since Inception (Daily) | Max Drawdown (Since Inception) |
| -26.52M | 14.62% |
Basic Info
| Investment Strategy | |
| The Fund seeks long-term capital appreciation by investing primarily in equity securities of small and mid-cap companies that have above-average growth prospects. Most of the Fund's assets will be invested in securities located outside the US and traded on foreign markets. |
| General | |
| Security Type | Mutual Fund |
| Equity Style | Mid Cap Core |
| Broad Asset Class | International Equity |
| Broad Category | Equity |
| Global Peer Group | Equity Global ex US Sm&Mid Cap |
| Peer Group | International Small/Mid-Cap Core |
| Global Macro | Equity Global |
| US Macro | Developed International Markets Funds |
| YCharts Categorization | -- |
| YCharts Benchmark | -- |
| Prospectus Objective | International Small-Cap Funds |
| Fund Owner Firm Name | Franklin Templeton |
| Broad Asset Class Benchmark Index | |
| ^MSACXUSNTR | 100.0% |
Net Fund Flows Versus Peer Group
1 Month
% Rank:
61
-51.41M
Peer Group Low
84.52M
Peer Group High
1 Year
% Rank:
50
-26.52M
-319.98M
Peer Group Low
2.000B
Peer Group High
3 Months
% Rank:
61
-181.38M
Peer Group Low
440.15M
Peer Group High
3 Years
% Rank:
54
-1.267B
Peer Group Low
3.496B
Peer Group High
6 Months
% Rank:
55
-276.29M
Peer Group Low
1.623B
Peer Group High
5 Years
% Rank:
65
-2.302B
Peer Group Low
4.151B
Peer Group High
YTD
% Rank:
59
-187.98M
Peer Group Low
651.92M
Peer Group High
10 Years
% Rank:
83
-4.255B
Peer Group Low
6.252B
Peer Group High
Date Unavailable
Risk
Performance Versus Peer Group
Annual Total Returns Versus Peers
As of May 25, 2026.
Asset Allocation
As of February 28, 2026.
| Type | % Net |
|---|---|
| Cash | 2.30% |
| Stock | 94.82% |
| Bond | 0.11% |
| Convertible | 0.00% |
| Preferred | 2.13% |
| Other | 0.64% |
Top 10 Holdings
| Name | % Weight | Price | % Change |
|---|---|---|---|
| International Petroleum Corp. | 2.68% | 27.85 | 0.00% |
| Berkeley Group Holdings Plc | 2.62% | 46.00 | 0.00% |
| Jenoptik AG | 2.56% | 51.60 | 4.16% |
| Japan Material Co., Ltd. | 2.55% | -- | -- |
| Cogeco Communications, Inc. | 2.45% | 65.39 | 1.43% |
| SPIE SA | 2.36% | 57.13 | 0.00% |
| Aalberts NV | 2.31% | 42.68 | 0.00% |
| NOF Corp. | 2.31% | 17.86 | 0.00% |
|
Cash and Cash Equivalents
|
2.30% | -- | -- |
| Bellway Plc | 2.29% | 35.50 | 0.00% |
Fees & Availability
| Fees | |
| Actual 12B-1 Fee | -- |
| Actual Management Fee | 0.76% |
| Administration Fee | -- |
| Maximum Front Load | -- |
| Maximum Deferred Load | -- |
| Maximum Redemption Fee | 0.00% |
| General Availability | |
| Available for Insurance Product | No |
| Available for RRSP | No |
| Purchase Details | |
| Open to New Investors |
|
| Minimum Initial Investment | 500.00 None |
| Minimum Subsequent Investment | 0.00 None |
Basic Info
| Investment Strategy | |
| The Fund seeks long-term capital appreciation by investing primarily in equity securities of small and mid-cap companies that have above-average growth prospects. Most of the Fund's assets will be invested in securities located outside the US and traded on foreign markets. |
| General | |
| Security Type | Mutual Fund |
| Equity Style | Mid Cap Core |
| Broad Asset Class | International Equity |
| Broad Category | Equity |
| Global Peer Group | Equity Global ex US Sm&Mid Cap |
| Peer Group | International Small/Mid-Cap Core |
| Global Macro | Equity Global |
| US Macro | Developed International Markets Funds |
| YCharts Categorization | -- |
| YCharts Benchmark | -- |
| Prospectus Objective | International Small-Cap Funds |
| Fund Owner Firm Name | Franklin Templeton |
| Broad Asset Class Benchmark Index | |
| ^MSACXUSNTR | 100.0% |
Fundamentals
| General | |
| Distribution Yield | -- |
| Dividend Yield TTM (5-21-26) | 6.43% |
| 30-Day SEC Yield | -- |
| 7-Day SEC Yield | -- |
| Number of Holdings | 81 |
| Stock | |
| Weighted Average PE Ratio | 22.17 |
| Weighted Average Price to Sales Ratio | 3.055 |
| Weighted Average Price to Book Ratio | 3.615 |
| Weighted Median ROE | 18.17% |
| Weighted Median ROA | 9.21% |
| ROI (TTM) | 15.27% |
| Return on Investment (TTM) | 15.27% |
| Earning Yield | 0.0574 |
| LT Debt / Shareholders Equity | 0.4258 |
| Number of Equity Holdings | 60 |
As of February 28, 2026
Growth Metrics
| EPS Growth (1Y) | 8.67% |
| EPS Growth (3Y) | 4.65% |
| EPS Growth (5Y) | 12.15% |
| Sales Growth (1Y) | 8.37% |
| Sales Growth (3Y) | 10.24% |
| Sales Growth (5Y) | 9.35% |
| Sales per Share Growth (1Y) | 10.71% |
| Sales per Share Growth (3Y) | 11.27% |
| Operating Cash Flow - Growth Rate (3Y) | 13.79% |
As of February 28, 2026
Fund Details
Top Portfolio Holders
| Name | % Weight |
|---|---|
| Portfolio A | 5.00% |
| Portfolio B | 3.50% |
| Portfolio C | 2.25% |
Excel Add-In Codes
| Name: =YCI("M:PIVYX", "name") |
| Broad Asset Class: =YCI("M:PIVYX", "broad_asset_class") |
| Broad Category: =YCI("M:PIVYX", "broad_category_group") |
| Prospectus Objective: =YCI("M:PIVYX", "prospectus_objective") |
| To find the codes for any of our securities and financial metrics, see our Complete Excel Reference. |