

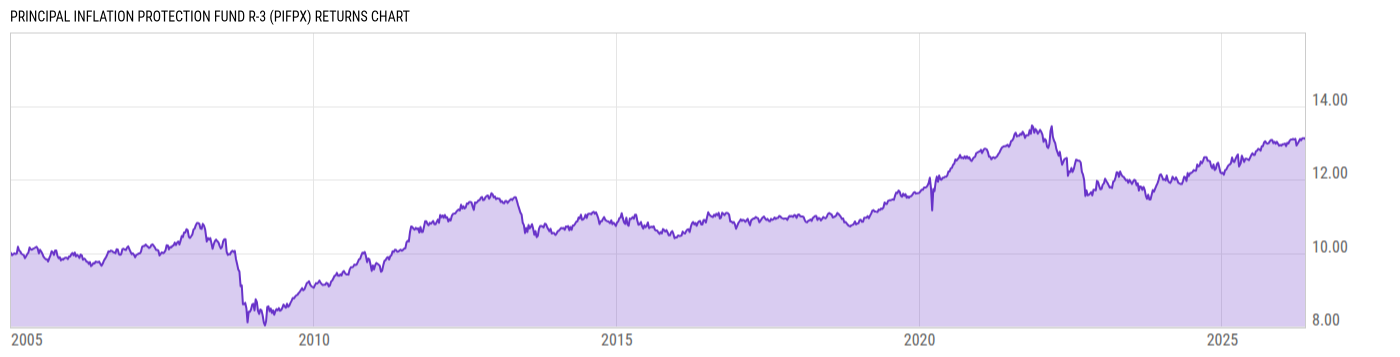
Principal Inflation Protection Fund R-3 (PIFPX)
7.33
0.00 (0.00%)
USD |
Jun 04 2026
Returns Chart
Key Stats
| Net Expense Ratio | Total Assets Under Management | Weighted Average Dividend Yield | Turnover Ratio (Generic) |
|---|---|---|---|
| 0.68% | 2.163B | -- | 154.0% |
| 1 Year Fund Level Flows | 1 Year Total Returns (Daily) | Annualized Total Returns Since Inception (Daily) | Max Drawdown (Since Inception) |
| -215.11M | 4.03% |
Basic Info
| Investment Strategy | |
| The Fund seeks to provide current income and real (after-inflation) total returns by investing primarily in inflation protected debt securities. |
| General | |
| Security Type | Mutual Fund |
| Equity Style | -- |
| Broad Asset Class | Taxable Bond |
| Broad Category | Fixed Income |
| Global Peer Group | Bond USD Inflation Linked |
| Peer Group | Inflation Protected Bond Funds |
| Global Macro | Bond HC |
| US Macro | Short-/Intermediate-Term U.S. Government & Treasury Funds |
| YCharts Categorization | -- |
| YCharts Benchmark | -- |
| Prospectus Objective | Inflation Protected Bond Funds |
| Fund Owner Firm Name | Principal |
| Broad Asset Class Benchmark Index | |
| ^BBUSATR | 100.0% |
Net Fund Flows Versus Peer Group
1 Month
% Rank:
19
-469.45M
Peer Group Low
1.496B
Peer Group High
1 Year
% Rank:
85
-215.11M
-813.70M
Peer Group Low
8.859B
Peer Group High
3 Months
% Rank:
89
-1.012B
Peer Group Low
3.557B
Peer Group High
3 Years
% Rank:
10
-8.412B
Peer Group Low
16.21B
Peer Group High
6 Months
% Rank:
89
-1.086B
Peer Group Low
4.259B
Peer Group High
5 Years
% Rank:
16
-12.69B
Peer Group Low
16.21B
Peer Group High
YTD
% Rank:
89
-1.263B
Peer Group Low
3.246B
Peer Group High
10 Years
% Rank:
56
-6.738B
Peer Group Low
44.79B
Peer Group High
Date Unavailable
Risk
Performance Versus Peer Group
Annual Total Returns Versus Peers
As of June 05, 2026.
Asset Allocation
As of April 30, 2026.
| Type | % Net |
|---|---|
| Cash | 0.74% |
| Stock | 0.00% |
| Bond | 99.25% |
| Convertible | 0.00% |
| Preferred | 0.00% |
| Other | 0.01% |
Top 10 Holdings
| Name | % Weight | Price | % Change |
|---|---|---|---|
| United States of America USGB 1.875 07/15/2035 FIX USD Government | 4.00% | 98.86 | -0.01% |
| United States of America USGB 2.125 01/15/2035 FIX USD Government | 4.00% | 100.86 | -0.03% |
| United States of America USGB 1.875 07/15/2034 FIX USD Government | 3.71% | 99.63 | -0.04% |
| United States of America USGB 1.75 01/15/2034 FIX USD Government | 3.66% | 98.73 | -0.04% |
| United States of America USGB 1.125 10/15/2030 FIX USD Government | 3.41% | 98.22 | -0.08% |
| United States of America USGB 1.625 04/15/2030 FIX USD Government | 3.40% | 100.02 | -0.08% |
| United States of America USGB 1.125 01/15/2033 FIX USD Government | 3.39% | 95.61 | -0.08% |
| United States of America USGB 1.625 10/15/2027 FIX USD Government | 3.33% | 100.84 | -0.08% |
| United States of America USGB 1.375 07/15/2033 FIX USD Government | 3.27% | 96.99 | -0.05% |
| United States of America USGB 1.625 10/15/2029 FIX USD Government | 3.26% | 100.58 | -0.10% |
Fees & Availability
| Fees | |
| Actual 12B-1 Fee | 0.25% |
| Actual Management Fee | 0.10% |
| Administration Fee | 4.00K% |
| Maximum Front Load | -- |
| Maximum Deferred Load | -- |
| Maximum Redemption Fee | -- |
| General Availability | |
| Available for Insurance Product | No |
| Available for RRSP | No |
| Purchase Details | |
| Open to New Investors |
|
| Minimum Initial Investment | 0.00 None |
| Minimum Subsequent Investment | 0.00 None |
Basic Info
| Investment Strategy | |
| The Fund seeks to provide current income and real (after-inflation) total returns by investing primarily in inflation protected debt securities. |
| General | |
| Security Type | Mutual Fund |
| Equity Style | -- |
| Broad Asset Class | Taxable Bond |
| Broad Category | Fixed Income |
| Global Peer Group | Bond USD Inflation Linked |
| Peer Group | Inflation Protected Bond Funds |
| Global Macro | Bond HC |
| US Macro | Short-/Intermediate-Term U.S. Government & Treasury Funds |
| YCharts Categorization | -- |
| YCharts Benchmark | -- |
| Prospectus Objective | Inflation Protected Bond Funds |
| Fund Owner Firm Name | Principal |
| Broad Asset Class Benchmark Index | |
| ^BBUSATR | 100.0% |
Fundamentals
| General | |
| Distribution Yield | -- |
| Dividend Yield TTM (6-3-26) | 4.27% |
| 30-Day SEC Yield (4-30-26) | 6.76% |
| 7-Day SEC Yield | -- |
| Number of Holdings | 54 |
| Bond | |
| Yield to Maturity (4-30-26) | 1.39% |
| Effective Duration | -- |
| Average Coupon | 1.27% |
| Calculated Average Quality | 2.000 |
| Effective Maturity | 7.145 |
| Nominal Maturity | 7.145 |
| Number of Bond Holdings | 51 |
As of April 30, 2026
Fund Details
Top Portfolio Holders
| Name | % Weight |
|---|---|
| Portfolio A | 5.00% |
| Portfolio B | 3.50% |
| Portfolio C | 2.25% |
Excel Add-In Codes
| Name: =YCI("M:PIFPX", "name") |
| Broad Asset Class: =YCI("M:PIFPX", "broad_asset_class") |
| Broad Category: =YCI("M:PIFPX", "broad_category_group") |
| Prospectus Objective: =YCI("M:PIFPX", "prospectus_objective") |
| To find the codes for any of our securities and financial metrics, see our Complete Excel Reference. |