

PGIM Global Total Return USD Hedged Fund A (PHEAX)
8.65
+0.03
(+0.35%)
USD |
Jun 09 2026
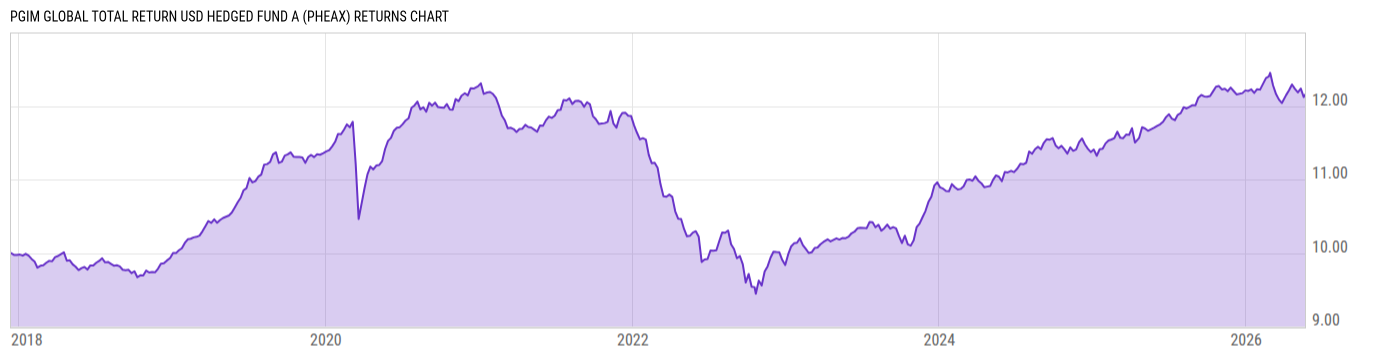
Returns Chart
Key Stats
| Net Expense Ratio | Total Assets Under Management | Weighted Average Dividend Yield | Turnover Ratio (Generic) |
|---|---|---|---|
| 0.88% | 30.92M | -- | 45.00% |
| 1 Year Fund Level Flows | 1 Year Total Returns (Daily) | Annualized Total Returns Since Inception (Daily) | Max Drawdown (Since Inception) |
| -21.39M | 4.22% |
Basic Info
| Investment Strategy | |
| The Fund seeks total return, through a combination of current income and capital appreciation. The Fund invests primarily in debt securities issued or guaranteed by governments, semi-government entities, government agencies, supranational entities and other governmental entities in the US and other countries. |
| General | |
| Security Type | Mutual Fund |
| Equity Style | -- |
| Broad Asset Class | Taxable Bond |
| Broad Category | Fixed Income |
| Global Peer Group | Bond Global USD |
| Peer Group | Global Income Funds |
| Global Macro | Bond Global |
| US Macro | World Income Funds |
| YCharts Categorization | -- |
| YCharts Benchmark | -- |
| Prospectus Objective | Global Income Funds |
| Fund Owner Firm Name | PGIM |
| Broad Asset Class Benchmark Index | |
| ^BBUSATR | 100.0% |
Net Fund Flows Versus Peer Group
1 Month
% Rank:
62
-35.14M
Peer Group Low
294.12M
Peer Group High
1 Year
% Rank:
69
-21.39M
-1.119B
Peer Group Low
1.537B
Peer Group High
3 Months
% Rank:
42
-325.40M
Peer Group Low
571.67M
Peer Group High
3 Years
% Rank:
54
-2.484B
Peer Group Low
2.741B
Peer Group High
6 Months
% Rank:
63
-731.75M
Peer Group Low
783.93M
Peer Group High
5 Years
% Rank:
46
-7.808B
Peer Group Low
3.313B
Peer Group High
YTD
% Rank:
64
-469.47M
Peer Group Low
717.27M
Peer Group High
10 Years
% Rank:
41
-47.03B
Peer Group Low
4.548B
Peer Group High
Date Unavailable
Risk
Performance Versus Peer Group
Annual Total Returns Versus Peers
As of June 10, 2026.
Asset Allocation
As of April 30, 2026.
| Type | % Net |
|---|---|
| Cash | 6.12% |
| Stock | 0.47% |
| Bond | 99.00% |
| Convertible | 0.00% |
| Preferred | 0.00% |
| Other | -5.59% |
Top 10 Holdings
| Name | % Weight | Price | % Change |
|---|---|---|---|
|
USD/EUR Forward Contract
|
31.01% | -- | -- |
| United States of America USGB 4.25 11/15/2034 FIX USD Government | 5.11% | 98.47 | 0.26% |
|
USD Cash
|
4.95% | -- | -- |
| United States of America USGB 3.625 10/31/2030 FIX USD Government | 3.48% | 97.53 | 0.16% |
|
USD/CNH Forward Contract
|
3.30% | -- | -- |
| United States of America USGB 3.375 11/15/2048 FIX USD Government | 3.22% | 77.29 | 0.59% |
| United States of America USGB 2.375 05/15/2051 FIX USD Government | 2.44% | 61.74 | 0.66% |
|
PGIM Core Government Money Market Fund
|
2.35% | -- | -- |
| United States of America USGB 4.375 01/31/2032 FIX USD Government | 2.12% | 100.34 | 0.18% |
|
JPY/USD Forward Contract
|
1.82% | -- | -- |
Fees & Availability
| Fees | |
| Actual 12B-1 Fee | 0.25% |
| Actual Management Fee | 0.41% |
| Administration Fee | -- |
| Maximum Front Load | 3.25% |
| Maximum Deferred Load | -- |
| Maximum Redemption Fee | -- |
| General Availability | |
| Available for Insurance Product | No |
| Available for RRSP | No |
| Purchase Details | |
| Open to New Investors |
|
| Minimum Initial Investment | 1000.00 None |
| Minimum Subsequent Investment | 100.00 None |
Basic Info
| Investment Strategy | |
| The Fund seeks total return, through a combination of current income and capital appreciation. The Fund invests primarily in debt securities issued or guaranteed by governments, semi-government entities, government agencies, supranational entities and other governmental entities in the US and other countries. |
| General | |
| Security Type | Mutual Fund |
| Equity Style | -- |
| Broad Asset Class | Taxable Bond |
| Broad Category | Fixed Income |
| Global Peer Group | Bond Global USD |
| Peer Group | Global Income Funds |
| Global Macro | Bond Global |
| US Macro | World Income Funds |
| YCharts Categorization | -- |
| YCharts Benchmark | -- |
| Prospectus Objective | Global Income Funds |
| Fund Owner Firm Name | PGIM |
| Broad Asset Class Benchmark Index | |
| ^BBUSATR | 100.0% |
Fundamentals
| General | |
| Distribution Yield | -- |
| Dividend Yield TTM (6-8-26) | 3.87% |
| 30-Day SEC Yield (4-30-26) | 3.69% |
| 7-Day SEC Yield | -- |
| Number of Holdings | 371 |
| Bond | |
| Yield to Maturity (4-30-26) | 4.68% |
| Effective Duration | 7.30 |
| Average Coupon | 4.05% |
| Calculated Average Quality | 3.397 |
| Effective Maturity | 8.013 |
| Nominal Maturity | 9.253 |
| Number of Bond Holdings | 268 |
As of April 30, 2026
Fund Details
Top Portfolio Holders
| Name | % Weight |
|---|---|
| Portfolio A | 5.00% |
| Portfolio B | 3.50% |
| Portfolio C | 2.25% |
Excel Add-In Codes
| Name: =YCI("M:PHEAX", "name") |
| Broad Asset Class: =YCI("M:PHEAX", "broad_asset_class") |
| Broad Category: =YCI("M:PHEAX", "broad_category_group") |
| Prospectus Objective: =YCI("M:PHEAX", "prospectus_objective") |
| To find the codes for any of our securities and financial metrics, see our Complete Excel Reference. |