

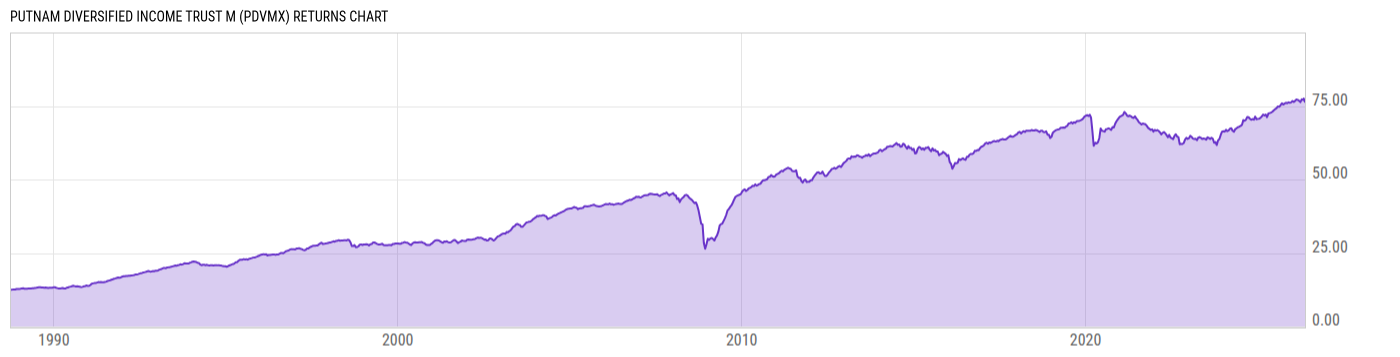
Putnam Diversified Income Trust M (PDVMX)
4.82
0.00 (0.00%)
USD |
Jun 09 2026
Returns Chart
Key Stats
| Net Expense Ratio | Total Assets Under Management | Weighted Average Dividend Yield | Turnover Ratio (Generic) |
|---|---|---|---|
| 1.24% | 908.77M | -- | 549.0% |
| 1 Year Fund Level Flows | 1 Year Total Returns (Daily) | Annualized Total Returns Since Inception (Daily) | Max Drawdown (Since Inception) |
| -172.18M | 5.48% |
Basic Info
| Investment Strategy | |
| The Fund seeks as high a level of current income as the Investment Manager believes is consistent with preservation of capital. The Fund invest mainly in bonds that are securitized debt instruments and related derivative instruments, and other obligations of companies and governments worldwide. |
| General | |
| Security Type | Mutual Fund |
| Equity Style | -- |
| Broad Asset Class | Taxable Bond |
| Broad Category | Alternative Strategies |
| Global Peer Group | Alternative Credit Focus |
| Peer Group | Alternative Credit Focus Funds |
| Global Macro | Alternative Bond |
| US Macro | Alternative Bond Funds |
| YCharts Categorization | -- |
| YCharts Benchmark | -- |
| Prospectus Objective | Alternative Credit Focus Funds |
| Fund Owner Firm Name | Franklin Templeton |
| Broad Asset Class Benchmark Index | |
| ^BBUSATR | 100.0% |
Net Fund Flows Versus Peer Group
1 Month
% Rank:
93
-11.14M
Peer Group Low
168.46M
Peer Group High
1 Year
% Rank:
94
-172.18M
-914.98M
Peer Group Low
3.343B
Peer Group High
3 Months
% Rank:
83
-264.79M
Peer Group Low
869.06M
Peer Group High
3 Years
% Rank:
97
-703.80M
Peer Group Low
4.117B
Peer Group High
6 Months
% Rank:
94
-407.31M
Peer Group Low
2.256B
Peer Group High
5 Years
% Rank:
97
-1.870B
Peer Group Low
2.716B
Peer Group High
YTD
% Rank:
94
-301.59M
Peer Group Low
2.047B
Peer Group High
10 Years
% Rank:
89
-11.22B
Peer Group Low
6.503B
Peer Group High
Date Unavailable
Risk
Performance Versus Peer Group
Annual Total Returns Versus Peers
As of June 10, 2026.
Asset Allocation
As of April 30, 2026.
| Type | % Net |
|---|---|
| Cash | 3.00% |
| Stock | 0.00% |
| Bond | 85.36% |
| Convertible | 0.00% |
| Preferred | 0.00% |
| Other | 11.64% |
Top 10 Holdings
| Name | % Weight | Price | % Change |
|---|---|---|---|
| FEDERAL NATIONAL MORTGAGE ASSOCIATION FNMA-New 05/15/2035 FIX USD Agency | 6.07% | 96.43 | -0.12% |
|
Government National Mortgage Association 2 5.5% 01-MAY-2056
|
3.51% | -- | -- |
| FNMA-New 6.0 05/15/2036 FIX USD Agency | 1.89% | 102.24 | -0.02% |
| Franklin Ultra Short Bond ETF | 1.88% | 24.94 | 0.02% |
|
Federal National Mortgage Association 5% 01-MAY-2056
|
1.61% | -- | -- |
|
AutoNation Inc 0% 01-MAY-2026
|
0.94% | -- | -- |
|
Federal National Mortgage Association 2.5% 01-MAY-2056
|
0.82% | -- | -- |
|
Federal National Mortgage Association 6.5% 01-MAY-2056
|
0.79% | -- | -- |
|
Federal National Mortgage Association 3.5% 01-MAY-2056
|
0.69% | -- | -- |
| ENERGY TRANSFER LP ENERTRAE 05/01/2026 FIX USD Corporate (Matured) | 0.67% | -- | -- |
Fees & Availability
| Fees | |
| Actual 12B-1 Fee | 0.50% |
| Actual Management Fee | 0.52% |
| Administration Fee | -- |
| Maximum Front Load | 4.00% |
| Maximum Deferred Load | -- |
| Maximum Redemption Fee | 0.00% |
| General Availability | |
| Available for Insurance Product | No |
| Available for RRSP | No |
| Purchase Details | |
| Open to New Investors |
|
| Minimum Initial Investment | 500.00 None |
| Minimum Subsequent Investment | 0.00 None |
Basic Info
| Investment Strategy | |
| The Fund seeks as high a level of current income as the Investment Manager believes is consistent with preservation of capital. The Fund invest mainly in bonds that are securitized debt instruments and related derivative instruments, and other obligations of companies and governments worldwide. |
| General | |
| Security Type | Mutual Fund |
| Equity Style | -- |
| Broad Asset Class | Taxable Bond |
| Broad Category | Alternative Strategies |
| Global Peer Group | Alternative Credit Focus |
| Peer Group | Alternative Credit Focus Funds |
| Global Macro | Alternative Bond |
| US Macro | Alternative Bond Funds |
| YCharts Categorization | -- |
| YCharts Benchmark | -- |
| Prospectus Objective | Alternative Credit Focus Funds |
| Fund Owner Firm Name | Franklin Templeton |
| Broad Asset Class Benchmark Index | |
| ^BBUSATR | 100.0% |
Fundamentals
| General | |
| Distribution Yield | -- |
| Dividend Yield TTM (6-8-26) | 4.96% |
| 30-Day SEC Yield (4-30-26) | 4.01% |
| 7-Day SEC Yield | -- |
| Number of Holdings | 863 |
| Bond | |
| Yield to Maturity (4-30-26) | 5.50% |
| Effective Duration | 3.05 |
| Average Coupon | 5.49% |
| Calculated Average Quality | 3.647 |
| Effective Maturity | 12.89 |
| Nominal Maturity | 12.94 |
| Number of Bond Holdings | 737 |
As of April 30, 2026
Fund Details
| Key Dates | |
| Inception Date | 10/3/1988 |
| Last Annual Report Date | 9/30/2025 |
| Last Prospectus Date | 2/1/2026 |
| Share Classes | |
| PDINX | A |
| PDVCX | C |
| PDVGX | Retirement |
| PDVRX | Retirement |
| PDVYX | Inst |
| Attributes | |
| Index Fund | -- |
| Inverse Fund | No |
| Leveraged Fund | -- |
| Fund of Funds | No |
| Currency Hedged Fund | -- |
| Socially Responsible Fund | No |
Top Portfolio Holders
| Name | % Weight |
|---|---|
| Portfolio A | 5.00% |
| Portfolio B | 3.50% |
| Portfolio C | 2.25% |
Excel Add-In Codes
| Name: =YCI("M:PDVMX", "name") |
| Broad Asset Class: =YCI("M:PDVMX", "broad_asset_class") |
| Broad Category: =YCI("M:PDVMX", "broad_category_group") |
| Prospectus Objective: =YCI("M:PDVMX", "prospectus_objective") |
| To find the codes for any of our securities and financial metrics, see our Complete Excel Reference. |