

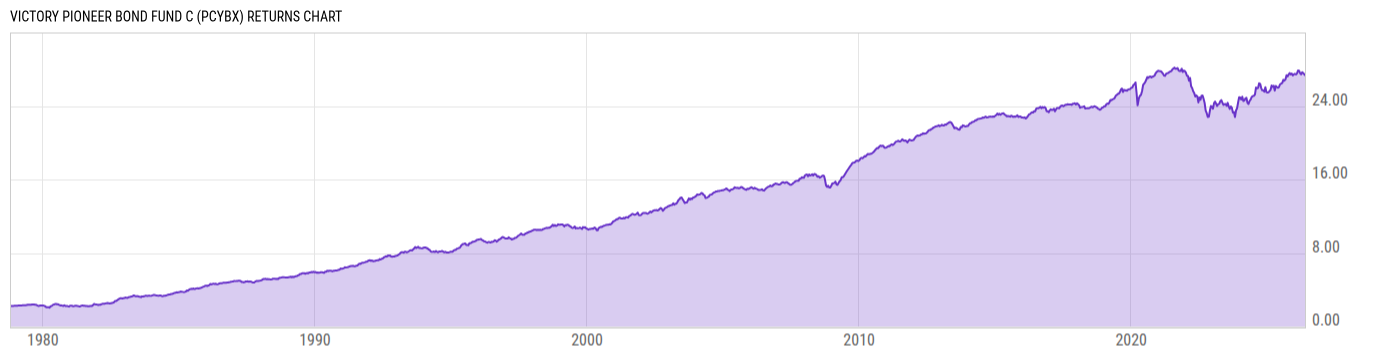
Victory Pioneer Bond Fund C (PCYBX)
8.29
+0.01
(+0.12%)
USD |
May 22 2026
Returns Chart
Key Stats
| Net Expense Ratio | Total Assets Under Management | Weighted Average Dividend Yield | Turnover Ratio (Generic) |
|---|---|---|---|
| 1.45% | 5.198B | -- | 44.00% |
| 1 Year Fund Level Flows | 1 Year Total Returns (Daily) | Annualized Total Returns Since Inception (Daily) | Max Drawdown (Since Inception) |
| 45.65M | 5.44% |
Basic Info
| Investment Strategy | |
| The Fund seeks current income and total return. Normally, the Fund invests at least 80% of its net assets in bonds. For purposes of this policy, bonds include all fixed income investments other than preferred stock. |
| General | |
| Security Type | Mutual Fund |
| Equity Style | -- |
| Broad Asset Class | Taxable Bond |
| Broad Category | Fixed Income |
| Global Peer Group | Bond USD Corporates |
| Peer Group | Corporate Debt Funds A Rated |
| Global Macro | Bond Corporates |
| US Macro | General Domestic Taxable Fixed Income Funds |
| YCharts Categorization | -- |
| YCharts Benchmark | -- |
| Prospectus Objective | Corporate Debt Funds A Rated |
| Fund Owner Firm Name | Victory Funds |
| Broad Asset Class Benchmark Index | |
| ^BBUSATR | 100.0% |
Net Fund Flows Versus Peer Group
1 Month
% Rank:
21
-135.41M
Peer Group Low
8.691M
Peer Group High
1 Year
% Rank:
12
45.65M
-1.718B
Peer Group Low
126.36M
Peer Group High
3 Months
% Rank:
36
-349.20M
Peer Group Low
35.15M
Peer Group High
3 Years
% Rank:
33
-6.489B
Peer Group Low
517.11M
Peer Group High
6 Months
% Rank:
21
-636.68M
Peer Group Low
173.21M
Peer Group High
5 Years
% Rank:
74
-6.895B
Peer Group Low
716.48M
Peer Group High
YTD
% Rank:
68
-430.69M
Peer Group Low
94.06M
Peer Group High
10 Years
% Rank:
24
-6.234B
Peer Group Low
1.372B
Peer Group High
Date Unavailable
Risk
Performance Versus Peer Group
Annual Total Returns Versus Peers
As of May 23, 2026.
Asset Allocation
As of January 31, 2026.
| Type | % Net |
|---|---|
| Cash | 3.27% |
| Stock | 0.12% |
| Bond | 96.62% |
| Convertible | 0.00% |
| Preferred | 0.25% |
| Other | -0.26% |
Top 10 Holdings
| Name | % Weight | Price | % Change |
|---|---|---|---|
| United States of America USGB 02/10/2026 FIX USD Government (Matured) | 4.78% | -- | -- |
| United States of America USGB 02/05/2026 FIX USD Government (Matured) | 4.31% | -- | -- |
| United States of America USGB 4.375 08/15/2043 FIX USD Government | 2.48% | 92.47 | 0.19% |
|
REPO GENERAL SECURITY
|
1.93% | -- | -- |
| FEDERAL NATIONAL MORTGAGE ASSOCIATION FNMA-New 3.5 02/01/2042 FIX USD Agency | 1.81% | -- | -- |
| FEDERAL NATIONAL MORTGAGE ASSOCIATION FNMA-New 5.0 12/02/2045 FIX USD Agency | 1.57% | -- | -- |
| Dreyfus Government Cash Management Institutional | 1.48% | 1.00 | 0.00% |
| United States of America USGB 4.0 01/31/2031 FIX USD Government | 1.47% | 98.91 | -0.12% |
|
FEDERAL NATIONAL MORTGAGE ASSOCIATION 5.5% 01-FEB-2041
|
1.21% | -- | -- |
|
FEDERAL NATIONAL MORTGAGE ASSOCIATION 4.5% 01-FEB-2056
|
1.21% | -- | -- |
Fees & Availability
| Fees | |
| Actual 12B-1 Fee | 1.00% |
| Actual Management Fee | 0.29% |
| Administration Fee | 5.06K% |
| Maximum Front Load | 0.00% |
| Maximum Deferred Load | 1.00% |
| Maximum Redemption Fee | -- |
| General Availability | |
| Available for Insurance Product | No |
| Available for RRSP | No |
| Purchase Details | |
| Open to New Investors |
|
| Minimum Initial Investment | 1000.00 None |
| Minimum Subsequent Investment | 500.00 None |
Basic Info
| Investment Strategy | |
| The Fund seeks current income and total return. Normally, the Fund invests at least 80% of its net assets in bonds. For purposes of this policy, bonds include all fixed income investments other than preferred stock. |
| General | |
| Security Type | Mutual Fund |
| Equity Style | -- |
| Broad Asset Class | Taxable Bond |
| Broad Category | Fixed Income |
| Global Peer Group | Bond USD Corporates |
| Peer Group | Corporate Debt Funds A Rated |
| Global Macro | Bond Corporates |
| US Macro | General Domestic Taxable Fixed Income Funds |
| YCharts Categorization | -- |
| YCharts Benchmark | -- |
| Prospectus Objective | Corporate Debt Funds A Rated |
| Fund Owner Firm Name | Victory Funds |
| Broad Asset Class Benchmark Index | |
| ^BBUSATR | 100.0% |
Fundamentals
| General | |
| Distribution Yield | -- |
| Dividend Yield TTM (5-21-26) | 3.55% |
| 30-Day SEC Yield (4-30-26) | 4.48% |
| 7-Day SEC Yield | -- |
| Number of Holdings | 1892 |
| Bond | |
| Yield to Maturity (1-31-26) | 4.71% |
| Effective Duration | 6.16 |
| Average Coupon | 5.09% |
| Calculated Average Quality | 2.776 |
| Effective Maturity | 14.92 |
| Nominal Maturity | 15.00 |
| Number of Bond Holdings | 1806 |
As of January 31, 2026
Fund Details
Top Portfolio Holders
| Name | % Weight |
|---|---|
| Portfolio A | 5.00% |
| Portfolio B | 3.50% |
| Portfolio C | 2.25% |
Excel Add-In Codes
| Name: =YCI("M:PCYBX", "name") |
| Broad Asset Class: =YCI("M:PCYBX", "broad_asset_class") |
| Broad Category: =YCI("M:PCYBX", "broad_category_group") |
| Prospectus Objective: =YCI("M:PCYBX", "prospectus_objective") |
| To find the codes for any of our securities and financial metrics, see our Complete Excel Reference. |