

Putnam Retirement Advantage 2065 Fund R5 (PCKIX)
14.93
-0.01
(-0.07%)
USD |
Jun 09 2026
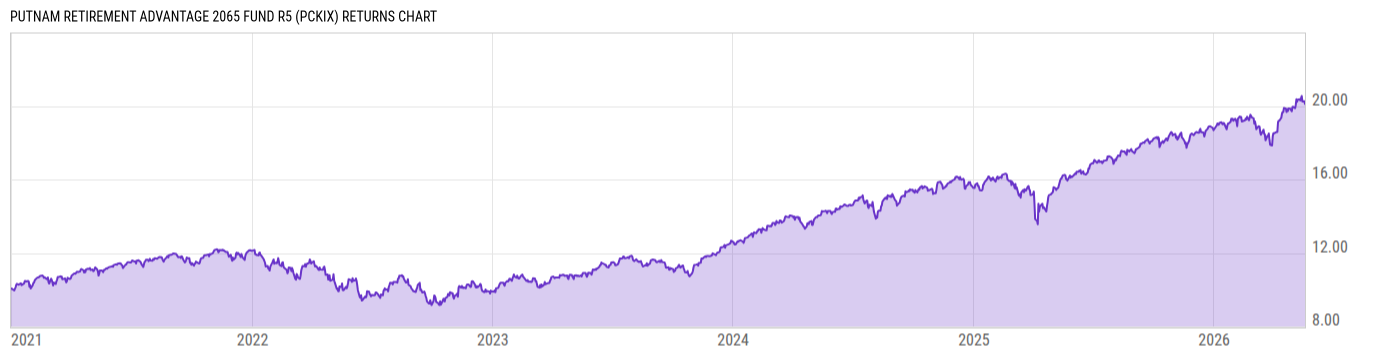
Returns Chart
Key Stats
| Net Expense Ratio | Total Assets Under Management | Weighted Average Dividend Yield | Turnover Ratio (Generic) |
|---|---|---|---|
| 0.55% | 5.672M | -- | 48.00% |
| 1 Year Fund Level Flows | 1 Year Total Returns (Daily) | Annualized Total Returns Since Inception (Daily) | Max Drawdown (Since Inception) |
| 1.486M | 23.81% |
Basic Info
| Investment Strategy | |
| The Fund seeks capital appreciation and current income consistent with a decreasing emphasis on capital appreciation and an increasing emphasis on current income as it approaches its target date of 2065. Putnam Management will adjust these funds allocations at the end of each calendar quarter based on the glide path. |
| General | |
| Security Type | Mutual Fund |
| Equity Style | -- |
| Broad Asset Class | Allocation |
| Broad Category | Allocation |
| Global Peer Group | Target Maturity MA USD 2060+ |
| Peer Group | Mixed-Asset Target 2060+ Funds |
| Global Macro | Target Maturity |
| US Macro | Mixed-Assets Target Date Funds |
| YCharts Categorization | -- |
| YCharts Benchmark | -- |
| Prospectus Objective | Growth Funds |
| Fund Owner Firm Name | Franklin Templeton |
| Broad Asset Class Benchmark Index | |
| ^SPXTR | 100.0% |
Net Fund Flows Versus Peer Group
1 Month
% Rank:
62
-39.17M
Peer Group Low
216.79M
Peer Group High
1 Year
% Rank:
82
1.486M
-7.726M
Peer Group Low
2.718B
Peer Group High
3 Months
% Rank:
64
-19.51M
Peer Group Low
798.19M
Peer Group High
3 Years
% Rank:
78
187376.0
Peer Group Low
6.729B
Peer Group High
6 Months
% Rank:
78
-19.82M
Peer Group Low
1.620B
Peer Group High
5 Years
% Rank:
77
187376.0
Peer Group Low
8.620B
Peer Group High
YTD
% Rank:
74
-25.54M
Peer Group Low
1.422B
Peer Group High
10 Years
% Rank:
78
187376.0
Peer Group Low
9.652B
Peer Group High
Date Unavailable
Risk
Performance Versus Peer Group
Annual Total Returns Versus Peers
As of June 10, 2026.
Asset Allocation
As of April 30, 2026.
| Type | % Net |
|---|---|
| Cash | 2.34% |
| Stock | 90.41% |
| Bond | 2.82% |
| Convertible | 0.00% |
| Preferred | 0.22% |
| Other | 4.21% |
Top 4 Holdings
| Name | % Weight | Price | % Change |
|---|---|---|---|
| Putnam Dynamic Asset Allocation Equity P | 76.86% | 18.21 | -0.11% |
| Putnam Dynamic Asset Allocation Growth Fund P | 22.09% | 23.63 | -0.04% |
|
CASH AND CASH EQUIVALENTS
|
0.63% | -- | -- |
|
PUTNAM SHORT TERM INVESTMENT FUND
|
0.42% | -- | -- |
Fees & Availability
| Fees | |
| Actual 12B-1 Fee | -- |
| Actual Management Fee | -- |
| Administration Fee | -- |
| Maximum Front Load | -- |
| Maximum Deferred Load | -- |
| Maximum Redemption Fee | -- |
| General Availability | |
| Available for Insurance Product | No |
| Available for RRSP | No |
| Purchase Details | |
| Open to New Investors |
|
| Minimum Initial Investment | 500.00 None |
| Minimum Subsequent Investment | 0.00 None |
Basic Info
| Investment Strategy | |
| The Fund seeks capital appreciation and current income consistent with a decreasing emphasis on capital appreciation and an increasing emphasis on current income as it approaches its target date of 2065. Putnam Management will adjust these funds allocations at the end of each calendar quarter based on the glide path. |
| General | |
| Security Type | Mutual Fund |
| Equity Style | -- |
| Broad Asset Class | Allocation |
| Broad Category | Allocation |
| Global Peer Group | Target Maturity MA USD 2060+ |
| Peer Group | Mixed-Asset Target 2060+ Funds |
| Global Macro | Target Maturity |
| US Macro | Mixed-Assets Target Date Funds |
| YCharts Categorization | -- |
| YCharts Benchmark | -- |
| Prospectus Objective | Growth Funds |
| Fund Owner Firm Name | Franklin Templeton |
| Broad Asset Class Benchmark Index | |
| ^SPXTR | 100.0% |
Fundamentals
| General | |
| Distribution Yield | -- |
| Dividend Yield TTM (6-8-26) | 2.08% |
| 30-Day SEC Yield | -- |
| 7-Day SEC Yield | -- |
| Number of Holdings | 4 |
| Stock | |
| Weighted Average PE Ratio | 28.05 |
| Weighted Average Price to Sales Ratio | 6.612 |
| Weighted Average Price to Book Ratio | 9.392 |
| Weighted Median ROE | 74.87% |
| Weighted Median ROA | 15.04% |
| ROI (TTM) | 22.44% |
| Return on Investment (TTM) | 22.44% |
| Earning Yield | 0.0509 |
| LT Debt / Shareholders Equity | 0.8426 |
| Number of Equity Holdings | 0 |
As of April 30, 2026
Growth Metrics
| EPS Growth (1Y) | 25.02% |
| EPS Growth (3Y) | 19.76% |
| EPS Growth (5Y) | 24.24% |
| Sales Growth (1Y) | 13.92% |
| Sales Growth (3Y) | 13.79% |
| Sales Growth (5Y) | 15.27% |
| Sales per Share Growth (1Y) | 78.59% |
| Sales per Share Growth (3Y) | 15.61% |
| Operating Cash Flow - Growth Rate (3Y) | 25.00% |
As of April 30, 2026
Fund Details
| Key Dates | |
| Inception Date | 12/30/2020 |
| Last Annual Report Date | 8/31/2025 |
| Last Prospectus Date | 1/1/2026 |
| Share Classes | |
| PCJZX | A |
| PCKBX | C |
| PCKEX | Inst |
| PCKFX | Retirement |
| PCKGX | Retirement |
| PCKHX | Retirement |
| PCKJX | Retirement |
| Attributes | |
| Index Fund | -- |
| Inverse Fund | No |
| Leveraged Fund | -- |
| Fund of Funds |
|
| Currency Hedged Fund | -- |
| Socially Responsible Fund | No |
Top Portfolio Holders
| Name | % Weight |
|---|---|
| Portfolio A | 5.00% |
| Portfolio B | 3.50% |
| Portfolio C | 2.25% |
Excel Add-In Codes
| Name: =YCI("M:PCKIX", "name") |
| Broad Asset Class: =YCI("M:PCKIX", "broad_asset_class") |
| Broad Category: =YCI("M:PCKIX", "broad_category_group") |
| Prospectus Objective: =YCI("M:PCKIX", "prospectus_objective") |
| To find the codes for any of our securities and financial metrics, see our Complete Excel Reference. |