

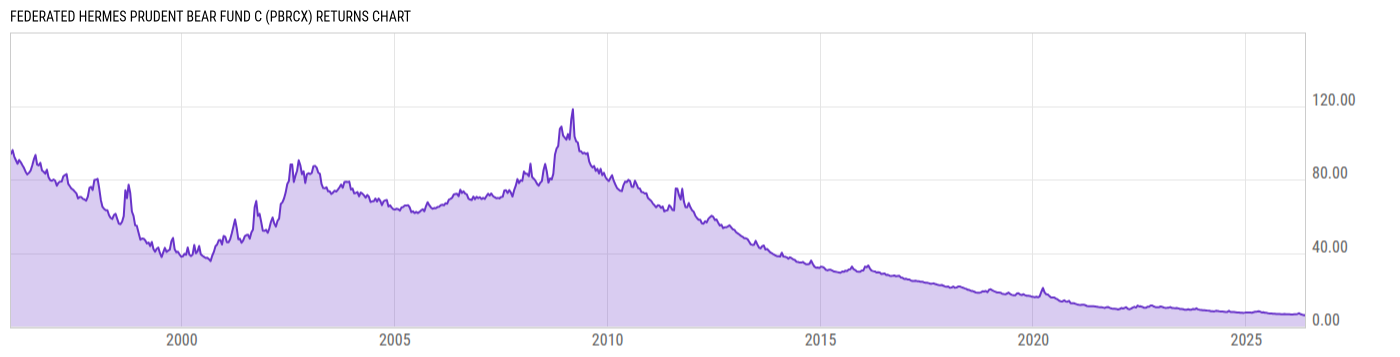
Federated Hermes Prudent Bear Fund C (PBRCX)
2.86
+0.01
(+0.35%)
USD |
Jun 09 2026
Returns Chart
Key Stats
| Net Expense Ratio | Total Assets Under Management | Weighted Average Dividend Yield | Turnover Ratio (Generic) |
|---|---|---|---|
| 3.45% | 90.36M | -- | 249.0% |
| 1 Year Fund Level Flows | 1 Year Total Returns (Daily) | Annualized Total Returns Since Inception (Daily) | Max Drawdown (Since Inception) |
| -1.792M | -16.66% |
Basic Info
| Investment Strategy | |
| The Fund seeks to provide capital appreciation by investing primarily in common stocks, engaging in short sales and effecting transactions in stock index futures contracts, options on stock index future contracts and options on securities and stock indexes. |
| General | |
| Security Type | Mutual Fund |
| Equity Style | -- |
| Broad Asset Class | Alternative |
| Broad Category | Alternative Strategies |
| Global Peer Group | Alternative Dedicated Short Bias |
| Peer Group | Dedicated Short Bias Funds |
| Global Macro | Liquid Alternatives |
| US Macro | Alternative Equity Funds |
| YCharts Categorization | -- |
| YCharts Benchmark | -- |
| Prospectus Objective | Dedicated Short Bias Funds |
| Fund Owner Firm Name | Federated Hermes |
| Broad Asset Class Benchmark Index | |
| ^MSACWINTR | 100.0% |
Net Fund Flows Versus Peer Group
1 Month
% Rank:
15
-152.40M
Peer Group Low
1.341B
Peer Group High
1 Year
% Rank:
89
-1.792M
-293.98M
Peer Group Low
5.411B
Peer Group High
3 Months
% Rank:
18
-61.63M
Peer Group Low
3.342B
Peer Group High
3 Years
% Rank:
100
-629.45M
Peer Group Low
6.163B
Peer Group High
6 Months
% Rank:
85
-168.84M
Peer Group Low
3.921B
Peer Group High
5 Years
% Rank:
15
-749.31M
Peer Group Low
9.495B
Peer Group High
YTD
% Rank:
20
-198.88M
Peer Group Low
3.850B
Peer Group High
10 Years
% Rank:
30
-1.014B
Peer Group Low
15.03B
Peer Group High
Date Unavailable
Risk
Performance Versus Peer Group
Annual Total Returns Versus Peers
As of June 10, 2026.
Asset Allocation
As of March 31, 2026.
| Type | % Net |
|---|---|
| Cash | 75.06% |
| Stock | -50.07% |
| Bond | 76.15% |
| Convertible | 0.00% |
| Preferred | 0.00% |
| Other | -1.14% |
Top 10 Holdings
| Name | % Weight | Price | % Change |
|---|---|---|---|
|
USD Cash
|
59.64% | -- | -- |
|
Other Assets less Liabilities
|
46.15% | -- | -- |
| United States of America USGB 04/02/2026 FIX USD Government (Matured) | 31.85% | 100.00 | 0.01% |
| United States of America USGB 0.0 06/11/2026 FIX USD Government | 31.63% | 99.99 | 0.01% |
| Federated Hermes Government Obligations Fd Premier | 28.16% | 1.00 | 0.00% |
| innoscripta SE | 0.48% | -- | -- |
| Silvaco Group, Inc. | 0.42% | 11.72 | 2.72% |
| Wealthfront Corp. | 0.38% | 8.98 | -0.11% |
| Exzeo Group, Inc. | 0.37% | 13.10 | 0.00% |
| SOPHiA GENETICS SA | 0.35% | 5.27 | -2.41% |
Fees & Availability
| Fees | |
| Actual 12B-1 Fee | 0.75% |
| Actual Management Fee | 1.00% |
| Administration Fee | 8.11K% |
| Maximum Front Load | -- |
| Maximum Deferred Load | 1.00% |
| Maximum Redemption Fee | 0.00% |
| General Availability | |
| Available for Insurance Product | No |
| Available for RRSP | No |
| Purchase Details | |
| Open to New Investors |
|
| Minimum Initial Investment | 1500.00 None |
| Minimum Subsequent Investment | 100.00 None |
Basic Info
| Investment Strategy | |
| The Fund seeks to provide capital appreciation by investing primarily in common stocks, engaging in short sales and effecting transactions in stock index futures contracts, options on stock index future contracts and options on securities and stock indexes. |
| General | |
| Security Type | Mutual Fund |
| Equity Style | -- |
| Broad Asset Class | Alternative |
| Broad Category | Alternative Strategies |
| Global Peer Group | Alternative Dedicated Short Bias |
| Peer Group | Dedicated Short Bias Funds |
| Global Macro | Liquid Alternatives |
| US Macro | Alternative Equity Funds |
| YCharts Categorization | -- |
| YCharts Benchmark | -- |
| Prospectus Objective | Dedicated Short Bias Funds |
| Fund Owner Firm Name | Federated Hermes |
| Broad Asset Class Benchmark Index | |
| ^MSACWINTR | 100.0% |
Fundamentals
| General | |
| Distribution Yield | -- |
| Dividend Yield TTM (6-8-26) | 8.05% |
| 30-Day SEC Yield (5-31-26) | -0.03% |
| 7-Day SEC Yield | -- |
| Number of Holdings | 199 |
| Stock | |
| Weighted Average PE Ratio | 21.59 |
| Weighted Average Price to Sales Ratio | 4.826 |
| Weighted Average Price to Book Ratio | 6.318 |
| Weighted Median ROE | 169.6% |
| Weighted Median ROA | 3.26% |
| ROI (TTM) | 6.44% |
| Return on Investment (TTM) | 6.44% |
| Earning Yield | 0.0692 |
| LT Debt / Shareholders Equity | 1.117 |
| Number of Equity Holdings | 189 |
| Bond | |
| Yield to Maturity (3-31-26) | 3.67% |
| Effective Duration | -- |
| Average Coupon | -- |
| Calculated Average Quality | 5.00 |
| Effective Maturity | 0.1005 |
| Nominal Maturity | 0.1005 |
| Number of Bond Holdings | 2 |
As of March 31, 2026
Growth Metrics
| EPS Growth (1Y) | 22.60% |
| EPS Growth (3Y) | 28.06% |
| EPS Growth (5Y) | 18.14% |
| Sales Growth (1Y) | 25.61% |
| Sales Growth (3Y) | 18.65% |
| Sales Growth (5Y) | 19.27% |
| Sales per Share Growth (1Y) | 37.79% |
| Sales per Share Growth (3Y) | 19.53% |
| Operating Cash Flow - Growth Rate (3Y) | 21.00% |
As of March 31, 2026
Top Portfolio Holders
| Name | % Weight |
|---|---|
| Portfolio A | 5.00% |
| Portfolio B | 3.50% |
| Portfolio C | 2.25% |
Excel Add-In Codes
| Name: =YCI("M:PBRCX", "name") |
| Broad Asset Class: =YCI("M:PBRCX", "broad_asset_class") |
| Broad Category: =YCI("M:PBRCX", "broad_category_group") |
| Prospectus Objective: =YCI("M:PBRCX", "prospectus_objective") |
| To find the codes for any of our securities and financial metrics, see our Complete Excel Reference. |