

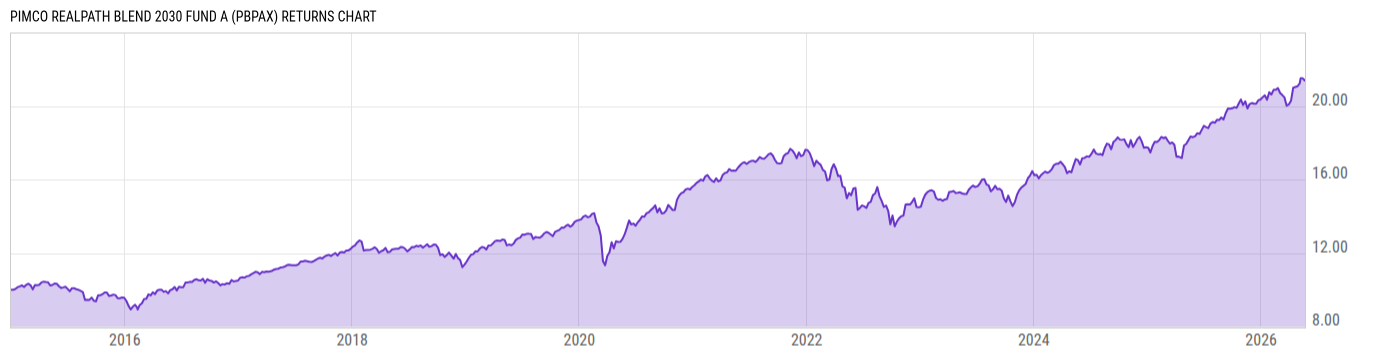
PIMCO RealPath Blend 2030 Fund A (PBPAX)
15.15
+0.03
(+0.20%)
USD |
May 22 2026
Returns Chart
Key Stats
| Net Expense Ratio | Total Assets Under Management | Weighted Average Dividend Yield | Turnover Ratio (Generic) |
|---|---|---|---|
| 1.17% | 585.64M | -- | 16.00% |
| 1 Year Fund Level Flows | 1 Year Total Returns (Daily) | Annualized Total Returns Since Inception (Daily) | Max Drawdown (Since Inception) |
| -93.14M | 18.41% |
Basic Info
| Investment Strategy | |
| The Fund seeks to maximize total return, consistent with prudent investment management. The Fund is for investors seeking professional management of a comprehensive asset allocation strategy for retirement savings. The Fund is managed for shareholders that plan to retire or begin withdrawing assets around the year 2030. |
| General | |
| Security Type | Mutual Fund |
| Equity Style | -- |
| Broad Asset Class | Allocation |
| Broad Category | Allocation |
| Global Peer Group | Target Maturity MA USD 2030 |
| Peer Group | Mixed-Asset Target 2030 Funds |
| Global Macro | Target Maturity |
| US Macro | Mixed-Assets Target Date Funds |
| YCharts Categorization | -- |
| YCharts Benchmark | -- |
| Prospectus Objective | Growth & Income Funds |
| Fund Owner Firm Name | PIMCO |
| Broad Asset Class Benchmark Index | |
| ^SPXTR | 100.0% |
Net Fund Flows Versus Peer Group
1 Month
% Rank:
15
-634.66M
Peer Group Low
53.69M
Peer Group High
1 Year
% Rank:
59
-93.14M
-4.669B
Peer Group Low
917.43M
Peer Group High
3 Months
% Rank:
57
-1.331B
Peer Group Low
542.00M
Peer Group High
3 Years
% Rank:
56
-9.883B
Peer Group Low
1.826B
Peer Group High
6 Months
% Rank:
60
-2.361B
Peer Group Low
918.80M
Peer Group High
5 Years
% Rank:
26
-19.88B
Peer Group Low
6.858B
Peer Group High
YTD
% Rank:
53
-1.523B
Peer Group Low
647.97M
Peer Group High
10 Years
% Rank:
36
-28.69B
Peer Group Low
17.94B
Peer Group High
Date Unavailable
Risk
Performance Versus Peer Group
Annual Total Returns Versus Peers
As of May 24, 2026.
Asset Allocation
As of December 31, 2025.
| Type | % Net |
|---|---|
| Cash | -9.23% |
| Stock | 45.49% |
| Bond | 56.29% |
| Convertible | 0.00% |
| Preferred | 0.09% |
| Other | 7.36% |
Top 10 Holdings
| Name | % Weight | Price | % Change |
|---|---|---|---|
| Vanguard Institutional Index Fund Inst Plus | 28.79% | 599.22 | 0.38% |
| PIMCO Total Return Fund Institutional | 12.48% | 8.68 | 0.12% |
| Vanguard Developed Markets Index Fund Inst | 11.70% | 22.68 | -0.18% |
| PIMCO Lg-Tr Real Return Fund Institutional | 9.02% | 11.16 | 0.36% |
| PIMCO Income Fund Institutional | 8.37% | 10.77 | 0.19% |
| PIMCO Long-Term US Government Fund Institutional | 8.12% | 13.56 | 0.44% |
| PIMCO Real Return Fund Institutional | 5.17% | 10.28 | -0.10% |
|
PIMCO Short-Term Floating NAV Portfolio III
|
4.67% | -- | -- |
| Vanguard Emerging Markets Stock Index Fund Inst | 3.97% | 37.19 | 0.57% |
| PIMCO Emerg Markets Local Currency and Bd Fd Inst | 2.84% | 6.21 | 0.00% |
Fees & Availability
| Fees | |
| Actual 12B-1 Fee | 0.25% |
| Actual Management Fee | 0.22% |
| Administration Fee | 18.51K% |
| Maximum Front Load | 5.50% |
| Maximum Deferred Load | -- |
| Maximum Redemption Fee | -- |
| General Availability | |
| Available for Insurance Product | -- |
| Available for RRSP | -- |
| Purchase Details | |
| Open to New Investors |
|
| Minimum Initial Investment | 1000.00 None |
| Minimum Subsequent Investment | 50.00 None |
Basic Info
| Investment Strategy | |
| The Fund seeks to maximize total return, consistent with prudent investment management. The Fund is for investors seeking professional management of a comprehensive asset allocation strategy for retirement savings. The Fund is managed for shareholders that plan to retire or begin withdrawing assets around the year 2030. |
| General | |
| Security Type | Mutual Fund |
| Equity Style | -- |
| Broad Asset Class | Allocation |
| Broad Category | Allocation |
| Global Peer Group | Target Maturity MA USD 2030 |
| Peer Group | Mixed-Asset Target 2030 Funds |
| Global Macro | Target Maturity |
| US Macro | Mixed-Assets Target Date Funds |
| YCharts Categorization | -- |
| YCharts Benchmark | -- |
| Prospectus Objective | Growth & Income Funds |
| Fund Owner Firm Name | PIMCO |
| Broad Asset Class Benchmark Index | |
| ^SPXTR | 100.0% |
Fundamentals
| General | |
| Distribution Yield | -- |
| Dividend Yield TTM (5-21-26) | 2.88% |
| 30-Day SEC Yield (4-30-26) | 2.54% |
| 7-Day SEC Yield | -- |
| Number of Holdings | 22 |
| Stock | |
| Weighted Average PE Ratio | 30.35 |
| Weighted Average Price to Sales Ratio | 7.354 |
| Weighted Average Price to Book Ratio | 8.935 |
| Weighted Median ROE | 54.50% |
| Weighted Median ROA | 13.67% |
| ROI (TTM) | 21.41% |
| Return on Investment (TTM) | 21.41% |
| Earning Yield | 0.0438 |
| LT Debt / Shareholders Equity | 0.8975 |
| Number of Equity Holdings | 0 |
| Bond | |
| Yield to Maturity (12-31-25) | 4.19% |
| Effective Duration | 4.47 |
| Average Coupon | 3.77% |
| Calculated Average Quality | 2.095 |
| Effective Maturity | 18.38 |
| Nominal Maturity | 18.42 |
| Number of Bond Holdings | 4 |
As of December 31, 2025
Growth Metrics
| EPS Growth (1Y) | 27.44% |
| EPS Growth (3Y) | 15.10% |
| EPS Growth (5Y) | 19.58% |
| Sales Growth (1Y) | 14.26% |
| Sales Growth (3Y) | 12.41% |
| Sales Growth (5Y) | 13.45% |
| Sales per Share Growth (1Y) | 18.92% |
| Sales per Share Growth (3Y) | 12.91% |
| Operating Cash Flow - Growth Rate (3Y) | 15.99% |
As of December 31, 2025
Fund Details
| Key Dates | |
| Inception Date | 12/31/2014 |
| Last Annual Report Date | 6/30/2025 |
| Last Prospectus Date | 10/31/2025 |
| Share Classes | |
| PBPNX | Inst |
| Attributes | |
| Index Fund | -- |
| Inverse Fund | -- |
| Leveraged Fund | -- |
| Fund of Funds |
|
| Currency Hedged Fund | -- |
| Socially Responsible Fund | No |
Top Portfolio Holders
| Name | % Weight |
|---|---|
| Portfolio A | 5.00% |
| Portfolio B | 3.50% |
| Portfolio C | 2.25% |
Excel Add-In Codes
| Name: =YCI("M:PBPAX", "name") |
| Broad Asset Class: =YCI("M:PBPAX", "broad_asset_class") |
| Broad Category: =YCI("M:PBPAX", "broad_category_group") |
| Prospectus Objective: =YCI("M:PBPAX", "prospectus_objective") |
| To find the codes for any of our securities and financial metrics, see our Complete Excel Reference. |