

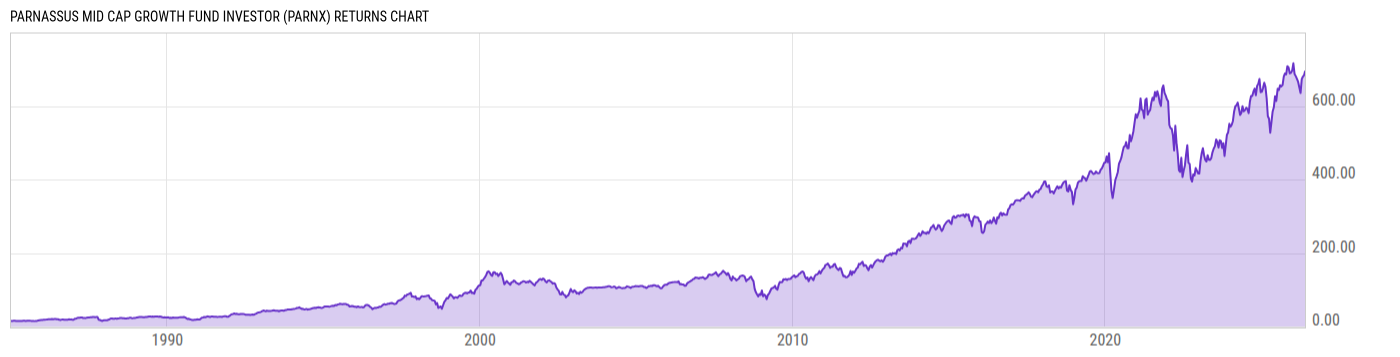
Parnassus Mid Cap Growth Fund Investor (PARNX)
54.48
+0.49
(+0.91%)
USD |
May 22 2026
Returns Chart
Key Stats
| Net Expense Ratio | Total Assets Under Management | Weighted Average Dividend Yield | Turnover Ratio (Generic) |
|---|---|---|---|
| 0.80% | 781.11M | 0.41% | 62.00% |
| 1 Year Fund Level Flows | 1 Year Total Returns (Daily) | Annualized Total Returns Since Inception (Daily) | Max Drawdown (Since Inception) |
| -100.26M | 15.02% |
Basic Info
| Investment Strategy | |
| The Fund seeks capital appreciation. The Fund is a multi-cap fund that it can invest in companies of any size, from larger, well-established companies to smaller companies with capitalizations below $1 billion. It invests in domestic stocks of companies that are financially sound and have good prospects for the future. |
| General | |
| Security Type | Mutual Fund |
| Equity Style | Mid Cap Growth |
| Broad Asset Class | US Equity |
| Broad Category | Equity |
| Global Peer Group | Equity US Sm&Mid Cap |
| Peer Group | Mid-Cap Growth Funds |
| Global Macro | Equity North America |
| US Macro | Mid-Cap Funds |
| YCharts Categorization | -- |
| YCharts Benchmark | -- |
| Prospectus Objective | Mid-Cap Funds |
| Fund Owner Firm Name | Parnassus Investments |
| Broad Asset Class Benchmark Index | |
| ^SPXTR | 100.0% |
Net Fund Flows Versus Peer Group
1 Month
% Rank:
58
-1.013B
Peer Group Low
357.97M
Peer Group High
1 Year
% Rank:
48
-100.26M
-6.509B
Peer Group Low
2.935B
Peer Group High
3 Months
% Rank:
50
-2.865B
Peer Group Low
977.59M
Peer Group High
3 Years
% Rank:
50
-14.69B
Peer Group Low
4.958B
Peer Group High
6 Months
% Rank:
52
-4.033B
Peer Group Low
1.477B
Peer Group High
5 Years
% Rank:
51
-20.02B
Peer Group Low
9.568B
Peer Group High
YTD
% Rank:
49
-3.039B
Peer Group Low
1.477B
Peer Group High
10 Years
% Rank:
54
-30.29B
Peer Group Low
9.568B
Peer Group High
Date Unavailable
Risk
Performance Versus Peer Group
Annual Total Returns Versus Peers
As of May 25, 2026.
Asset Allocation
As of March 31, 2026.
| Type | % Net |
|---|---|
| Cash | 0.71% |
| Stock | 99.29% |
| Bond | 0.00% |
| Convertible | 0.00% |
| Preferred | 0.00% |
| Other | 0.00% |
Top 10 Holdings
| Name | % Weight | Price | % Change |
|---|---|---|---|
| Hilton Worldwide Holdings, Inc. | 4.75% | 321.08 | -0.52% |
| Quanta Services, Inc. | 4.26% | 723.44 | 0.91% |
| Monolithic Power Systems, Inc. | 3.74% | 1589.81 | 1.83% |
| W.W. Grainger, Inc. | 3.64% | 1247.79 | 0.69% |
| Teradyne, Inc. | 3.57% | 358.44 | 1.41% |
| Rockwell Automation, Inc. | 3.28% | 452.29 | 2.73% |
| Royal Caribbean Group | 3.18% | 256.10 | -1.62% |
| Old Dominion Freight Line, Inc. | 3.09% | 210.47 | 1.34% |
| Cloudflare, Inc. | 3.05% | 216.17 | 1.66% |
| KLA Corp. | 3.04% | 1888.38 | 2.51% |
Fees & Availability
| Fees | |
| Actual 12B-1 Fee | -- |
| Actual Management Fee | 0.60% |
| Administration Fee | -- |
| Maximum Front Load | 0.00% |
| Maximum Deferred Load | -- |
| Maximum Redemption Fee | -- |
| General Availability | |
| Available for Insurance Product | No |
| Available for RRSP | No |
| Purchase Details | |
| Open to New Investors |
|
| Minimum Initial Investment | 2000.00 None |
| Minimum Subsequent Investment | 50.00 None |
Basic Info
| Investment Strategy | |
| The Fund seeks capital appreciation. The Fund is a multi-cap fund that it can invest in companies of any size, from larger, well-established companies to smaller companies with capitalizations below $1 billion. It invests in domestic stocks of companies that are financially sound and have good prospects for the future. |
| General | |
| Security Type | Mutual Fund |
| Equity Style | Mid Cap Growth |
| Broad Asset Class | US Equity |
| Broad Category | Equity |
| Global Peer Group | Equity US Sm&Mid Cap |
| Peer Group | Mid-Cap Growth Funds |
| Global Macro | Equity North America |
| US Macro | Mid-Cap Funds |
| YCharts Categorization | -- |
| YCharts Benchmark | -- |
| Prospectus Objective | Mid-Cap Funds |
| Fund Owner Firm Name | Parnassus Investments |
| Broad Asset Class Benchmark Index | |
| ^SPXTR | 100.0% |
Fundamentals
| General | |
| Distribution Yield | -- |
| Dividend Yield TTM (5-21-26) | 1.71% |
| 30-Day SEC Yield | -- |
| 7-Day SEC Yield | -- |
| Number of Holdings | 10 |
| Stock | |
| Weighted Average PE Ratio | 40.86 |
| Weighted Average Price to Sales Ratio | 9.563 |
| Weighted Average Price to Book Ratio | 11.06 |
| Weighted Median ROE | 19.63% |
| Weighted Median ROA | 8.70% |
| ROI (TTM) | 12.13% |
| Return on Investment (TTM) | 12.13% |
| Earning Yield | 0.0278 |
| LT Debt / Shareholders Equity | 0.7509 |
| Number of Equity Holdings | 10 |
As of March 31, 2026
Growth Metrics
| EPS Growth (1Y) | 15.69% |
| EPS Growth (3Y) | 11.92% |
| EPS Growth (5Y) | 19.73% |
| Sales Growth (1Y) | 17.23% |
| Sales Growth (3Y) | 15.43% |
| Sales Growth (5Y) | 21.48% |
| Sales per Share Growth (1Y) | 15.68% |
| Sales per Share Growth (3Y) | 15.08% |
| Operating Cash Flow - Growth Rate (3Y) | 34.07% |
As of March 31, 2026
Fund Details
| Key Dates | |
| Inception Date | 12/31/1984 |
| Last Annual Report Date | 12/31/2025 |
| Last Prospectus Date | 4/30/2026 |
| Share Classes | |
| PFPRX | Inst |
| Attributes | |
| Index Fund | -- |
| Inverse Fund | No |
| Leveraged Fund | -- |
| Fund of Funds | No |
| Currency Hedged Fund | -- |
| Socially Responsible Fund |
|
Top Portfolio Holders
| Name | % Weight |
|---|---|
| Portfolio A | 5.00% |
| Portfolio B | 3.50% |
| Portfolio C | 2.25% |
Excel Add-In Codes
| Name: =YCI("M:PARNX", "name") |
| Broad Asset Class: =YCI("M:PARNX", "broad_asset_class") |
| Broad Category: =YCI("M:PARNX", "broad_category_group") |
| Prospectus Objective: =YCI("M:PARNX", "prospectus_objective") |
| To find the codes for any of our securities and financial metrics, see our Complete Excel Reference. |