

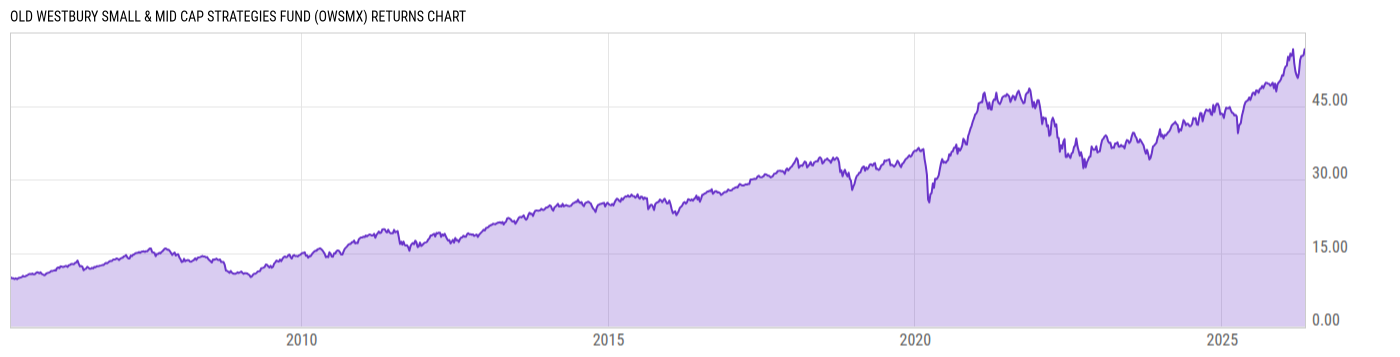
Old Westbury Small & Mid Cap Strategies Fund (OWSMX)
19.46
+0.07
(+0.36%)
USD |
May 29 2026
Returns Chart
Key Stats
| Net Expense Ratio | Total Assets Under Management | Weighted Average Dividend Yield | Turnover Ratio (Generic) |
|---|---|---|---|
| 1.10% | 9.579B | 1.94% | 61.00% |
| 1 Year Fund Level Flows | 1 Year Total Returns (Daily) | Annualized Total Returns Since Inception (Daily) | Max Drawdown (Since Inception) |
| -869.43M | 23.73% |
Basic Info
| Investment Strategy | |
| The Fund seeks long-term capital appreciation. The Fund invests in a broad, diversified portfolio of common stocks of small-capitalization companies of U.S. and non-U.S. companies in foreign countries, including emerging market countries. |
| General | |
| Security Type | Mutual Fund |
| Equity Style | Mid Cap Growth |
| Broad Asset Class | International Equity |
| Broad Category | Equity |
| Global Peer Group | Equity Global Sm&Mid Cap |
| Peer Group | Global Small-/Mid-Cap Funds |
| Global Macro | Equity Global |
| US Macro | Developed Global Markets Funds |
| YCharts Categorization | -- |
| YCharts Benchmark | -- |
| Prospectus Objective | Global Small-Cap Funds |
| Fund Owner Firm Name | Bessemer Trust |
| Broad Asset Class Benchmark Index | |
| ^MSACXUSNTR | 100.0% |
Net Fund Flows Versus Peer Group
1 Month
% Rank:
78
-1.063B
Peer Group Low
11.32M
Peer Group High
1 Year
% Rank:
83
-869.43M
-2.926B
Peer Group Low
378.09M
Peer Group High
3 Months
% Rank:
82
-1.071B
Peer Group Low
21.79M
Peer Group High
3 Years
% Rank:
81
-2.898B
Peer Group Low
462.91M
Peer Group High
6 Months
% Rank:
83
-2.601B
Peer Group Low
154.18M
Peer Group High
5 Years
% Rank:
92
-12.29B
Peer Group Low
3.306B
Peer Group High
YTD
% Rank:
78
-1.798B
Peer Group Low
78.30M
Peer Group High
10 Years
% Rank:
90
-13.28B
Peer Group Low
14.28B
Peer Group High
Date Unavailable
Risk
Performance Versus Peer Group
Annual Total Returns Versus Peers
As of May 30, 2026.
Asset Allocation
As of January 31, 2026.
| Type | % Net |
|---|---|
| Cash | 0.04% |
| Stock | 97.46% |
| Bond | 0.30% |
| Convertible | 0.00% |
| Preferred | 0.20% |
| Other | 2.00% |
Top 10 Holdings
| Name | % Weight | Price | % Change |
|---|---|---|---|
| VanEck Junior Gold Miners ETF | 3.60% | 119.29 | 3.88% |
|
Other Assets less Liabilities
|
1.60% | -- | -- |
| State Street SPDR S&P Biotech ETF | 1.14% | 136.69 | 0.51% |
|
SK Square Co Ltd ORD
|
0.75% | -- | -- |
| Keysight Technologies, Inc. | 0.56% | 338.33 | -0.24% |
| Nasdaq, Inc. | 0.53% | 92.52 | 1.67% |
| STERIS Plc (Ireland) | 0.53% | 212.73 | -1.24% |
| US Foods Holding Corp. | 0.52% | 81.85 | 0.86% |
| Clean Harbors, Inc. | 0.51% | 281.03 | 0.11% |
| Alibaba Group Holding Ltd. | 0.46% | 124.22 | -1.54% |
Fees & Availability
| Fees | |
| Actual 12B-1 Fee | -- |
| Actual Management Fee | 0.81% |
| Administration Fee | 4.01M% |
| Maximum Front Load | -- |
| Maximum Deferred Load | -- |
| Maximum Redemption Fee | -- |
| General Availability | |
| Available for Insurance Product | No |
| Available for RRSP | No |
| Purchase Details | |
| Open to New Investors |
|
| Minimum Initial Investment | 1000.00 None |
| Minimum Subsequent Investment | 100.00 None |
Basic Info
| Investment Strategy | |
| The Fund seeks long-term capital appreciation. The Fund invests in a broad, diversified portfolio of common stocks of small-capitalization companies of U.S. and non-U.S. companies in foreign countries, including emerging market countries. |
| General | |
| Security Type | Mutual Fund |
| Equity Style | Mid Cap Growth |
| Broad Asset Class | International Equity |
| Broad Category | Equity |
| Global Peer Group | Equity Global Sm&Mid Cap |
| Peer Group | Global Small-/Mid-Cap Funds |
| Global Macro | Equity Global |
| US Macro | Developed Global Markets Funds |
| YCharts Categorization | -- |
| YCharts Benchmark | -- |
| Prospectus Objective | Global Small-Cap Funds |
| Fund Owner Firm Name | Bessemer Trust |
| Broad Asset Class Benchmark Index | |
| ^MSACXUSNTR | 100.0% |
Fundamentals
| General | |
| Distribution Yield | -- |
| Dividend Yield TTM (5-28-26) | 1.45% |
| 30-Day SEC Yield | -- |
| 7-Day SEC Yield | -- |
| Number of Holdings | 2281 |
| Stock | |
| Weighted Average PE Ratio | 26.95 |
| Weighted Average Price to Sales Ratio | 4.208 |
| Weighted Average Price to Book Ratio | 4.264 |
| Weighted Median ROE | 13.00% |
| Weighted Median ROA | 6.16% |
| ROI (TTM) | 10.17% |
| Return on Investment (TTM) | 10.17% |
| Earning Yield | 0.0545 |
| LT Debt / Shareholders Equity | 0.7493 |
| Number of Equity Holdings | 2242 |
As of January 31, 2026
Growth Metrics
| EPS Growth (1Y) | 22.88% |
| EPS Growth (3Y) | 10.50% |
| EPS Growth (5Y) | 14.38% |
| Sales Growth (1Y) | 9.85% |
| Sales Growth (3Y) | 9.78% |
| Sales Growth (5Y) | 10.14% |
| Sales per Share Growth (1Y) | 49.16% |
| Sales per Share Growth (3Y) | 9.45% |
| Operating Cash Flow - Growth Rate (3Y) | 14.94% |
As of January 31, 2026
Fund Details
| Key Dates | |
| Inception Date | 4/7/2005 |
| Last Annual Report Date | 10/31/2025 |
| Last Prospectus Date | 2/15/2025 |
| Attributes | |
| Index Fund | -- |
| Inverse Fund | No |
| Leveraged Fund | -- |
| Fund of Funds | No |
| Currency Hedged Fund | -- |
| Socially Responsible Fund | No |
Top Portfolio Holders
| Name | % Weight |
|---|---|
| Portfolio A | 5.00% |
| Portfolio B | 3.50% |
| Portfolio C | 2.25% |
Excel Add-In Codes
| Name: =YCI("M:OWSMX", "name") |
| Broad Asset Class: =YCI("M:OWSMX", "broad_asset_class") |
| Broad Category: =YCI("M:OWSMX", "broad_category_group") |
| Prospectus Objective: =YCI("M:OWSMX", "prospectus_objective") |
| To find the codes for any of our securities and financial metrics, see our Complete Excel Reference. |