

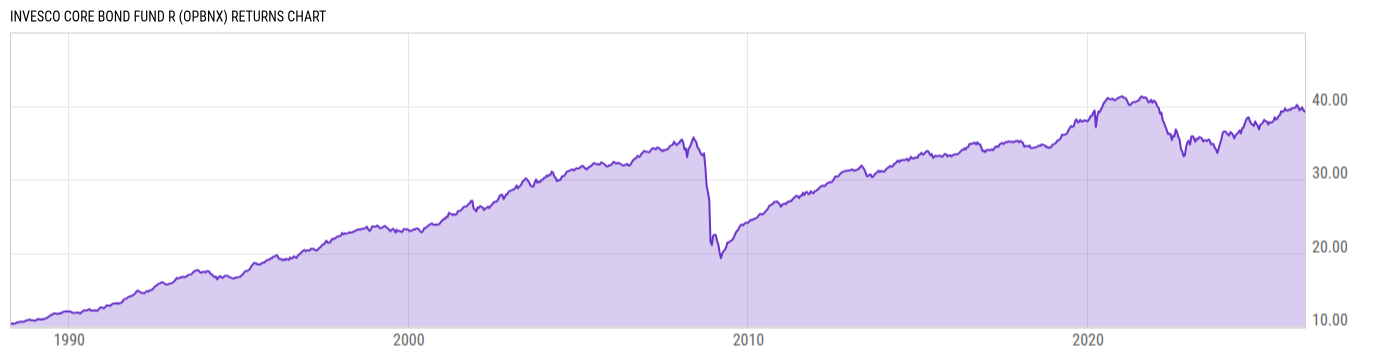
Invesco Core Bond Fund R (OPBNX)
5.60
0.00 (0.00%)
USD |
May 22 2026
Returns Chart
Key Stats
| Net Expense Ratio | Total Assets Under Management | Weighted Average Dividend Yield | Turnover Ratio (Generic) |
|---|---|---|---|
| 0.99% | 2.849B | -- | 627.0% |
| 1 Year Fund Level Flows | 1 Year Total Returns (Daily) | Annualized Total Returns Since Inception (Daily) | Max Drawdown (Since Inception) |
| -290.04M | 4.92% |
Basic Info
| Investment Strategy | |
| The Fund seeks total return. Under normal market conditions, the Fund invests at least 80% of its net assets, plus borrowings for investment purposes, in investment-grade debt securities (generally referred as bonds), and in derivatives and other instruments that have economic characteristics similar to such securities. |
| General | |
| Security Type | Mutual Fund |
| Equity Style | -- |
| Broad Asset Class | Taxable Bond |
| Broad Category | Fixed Income |
| Global Peer Group | Bond USD Medium Term |
| Peer Group | Core Bond Funds |
| Global Macro | Bond HC |
| US Macro | Short/Intermediate Investment-Grade Funds |
| YCharts Categorization | -- |
| YCharts Benchmark | -- |
| Prospectus Objective | Core Bond Funds |
| Fund Owner Firm Name | Invesco |
| Broad Asset Class Benchmark Index | |
| ^BBUSATR | 100.0% |
Net Fund Flows Versus Peer Group
1 Month
% Rank:
15
-3.494B
Peer Group Low
2.037B
Peer Group High
1 Year
% Rank:
89
-290.04M
-5.277B
Peer Group Low
37.06B
Peer Group High
3 Months
% Rank:
93
-5.205B
Peer Group Low
17.53B
Peer Group High
3 Years
% Rank:
30
-14.16B
Peer Group Low
92.64B
Peer Group High
6 Months
% Rank:
93
-5.281B
Peer Group Low
26.89B
Peer Group High
5 Years
% Rank:
31
-16.40B
Peer Group Low
123.65B
Peer Group High
YTD
% Rank:
93
-5.206B
Peer Group Low
17.53B
Peer Group High
10 Years
% Rank:
37
-15.16B
Peer Group Low
243.88B
Peer Group High
Date Unavailable
Risk
Performance Versus Peer Group
Annual Total Returns Versus Peers
As of May 24, 2026.
Asset Allocation
As of March 31, 2026.
| Type | % Net |
|---|---|
| Cash | -31.14% |
| Stock | 0.00% |
| Bond | 94.63% |
| Convertible | 0.00% |
| Preferred | 0.18% |
| Other | 36.32% |
Top 10 Holdings
| Name | % Weight | Price | % Change |
|---|---|---|---|
|
2YR T-NOTE JUN26
|
10.71% | -- | -- |
| Invesco Treasury Portfolio Institutional | 6.46% | 1.00 | 0.00% |
|
FEDERAL NATIONAL MORTGAGE ASSOCIATION 5% 01-MAY-2056
|
3.98% | -- | -- |
| Invesco Government & Agency Portfolio Inst | 3.52% | 1.00 | 0.00% |
| United States of America USGB 3.875 03/31/2028 FIX USD Government | 3.40% | 99.57 | -0.09% |
| United States of America USGB 4.625 11/15/2055 FIX USD Government | 3.29% | 93.20 | 0.35% |
|
US T BONDS JUN26
|
3.07% | -- | -- |
|
FEDERAL NATIONAL MORTGAGE ASSOCIATION 2% 01-MAY-2056
|
2.97% | -- | -- |
| United States of America USGB 4.125 02/15/2036 FIX USD Government | 2.54% | 96.65 | 0.01% |
|
FEDERAL NATIONAL MORTGAGE ASSOCIATION 3% 01-MAY-2056
|
2.54% | -- | -- |
Fees & Availability
| Fees | |
| Actual 12B-1 Fee | 0.50% |
| Actual Management Fee | 0.27% |
| Administration Fee | -- |
| Maximum Front Load | -- |
| Maximum Deferred Load | 0.00% |
| Maximum Redemption Fee | -- |
| General Availability | |
| Available for Insurance Product | No |
| Available for RRSP | No |
| Purchase Details | |
| Open to New Investors |
|
| Minimum Initial Investment | 0.00 None |
| Minimum Subsequent Investment | 0.00 None |
Basic Info
| Investment Strategy | |
| The Fund seeks total return. Under normal market conditions, the Fund invests at least 80% of its net assets, plus borrowings for investment purposes, in investment-grade debt securities (generally referred as bonds), and in derivatives and other instruments that have economic characteristics similar to such securities. |
| General | |
| Security Type | Mutual Fund |
| Equity Style | -- |
| Broad Asset Class | Taxable Bond |
| Broad Category | Fixed Income |
| Global Peer Group | Bond USD Medium Term |
| Peer Group | Core Bond Funds |
| Global Macro | Bond HC |
| US Macro | Short/Intermediate Investment-Grade Funds |
| YCharts Categorization | -- |
| YCharts Benchmark | -- |
| Prospectus Objective | Core Bond Funds |
| Fund Owner Firm Name | Invesco |
| Broad Asset Class Benchmark Index | |
| ^BBUSATR | 100.0% |
Fundamentals
| General | |
| Distribution Yield | -- |
| Dividend Yield TTM (5-22-26) | 3.96% |
| 30-Day SEC Yield (4-30-26) | 3.72% |
| 7-Day SEC Yield | -- |
| Number of Holdings | 10 |
| Bond | |
| Yield to Maturity (3-31-26) | 4.79% |
| Effective Duration | 6.00 |
| Average Coupon | 4.63% |
| Calculated Average Quality | 2.059 |
| Effective Maturity | 17.20 |
| Nominal Maturity | 17.20 |
| Number of Bond Holdings | 3 |
As of March 31, 2026
Fund Details
| Key Dates | |
| Inception Date | 4/15/1988 |
| Last Annual Report Date | 10/31/2025 |
| Last Prospectus Date | 2/27/2026 |
| Share Classes | |
| OPBCX | C |
| OPBIX | Retirement |
| OPBYX | Inst |
| OPIGX | A |
| TRTMX | Retirement |
| Attributes | |
| Index Fund | -- |
| Inverse Fund | No |
| Leveraged Fund | -- |
| Fund of Funds | No |
| Currency Hedged Fund | -- |
| Socially Responsible Fund | No |
Top Portfolio Holders
| Name | % Weight |
|---|---|
| Portfolio A | 5.00% |
| Portfolio B | 3.50% |
| Portfolio C | 2.25% |
Excel Add-In Codes
| Name: =YCI("M:OPBNX", "name") |
| Broad Asset Class: =YCI("M:OPBNX", "broad_asset_class") |
| Broad Category: =YCI("M:OPBNX", "broad_category_group") |
| Prospectus Objective: =YCI("M:OPBNX", "prospectus_objective") |
| To find the codes for any of our securities and financial metrics, see our Complete Excel Reference. |