

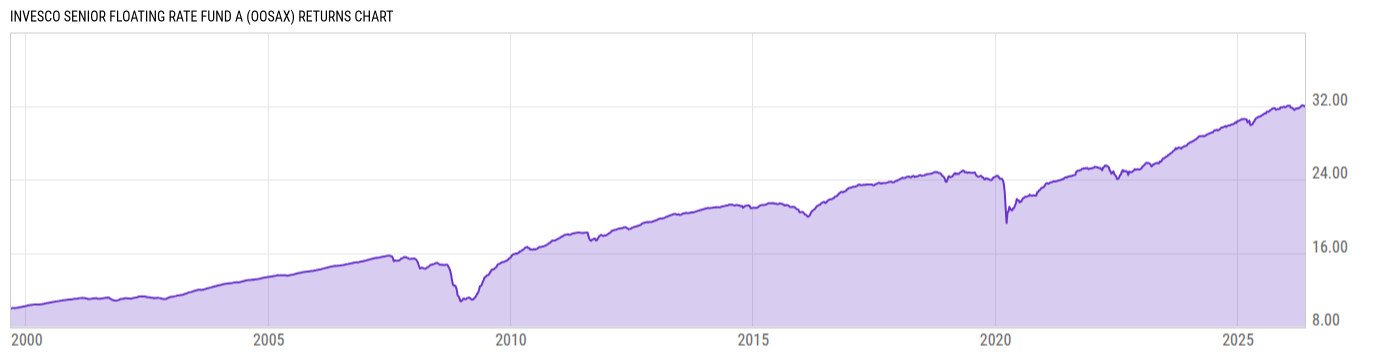
Invesco Senior Floating Rate Fund A (OOSAX)
6.25
0.00 (0.00%)
USD |
Jun 09 2026
Returns Chart
Key Stats
| Net Expense Ratio | Total Assets Under Management | Weighted Average Dividend Yield | Turnover Ratio (Generic) |
|---|---|---|---|
| 1.12% | 2.509B | -- | 49.00% |
| 1 Year Fund Level Flows | 1 Year Total Returns (Daily) | Annualized Total Returns Since Inception (Daily) | Max Drawdown (Since Inception) |
| -386.66M | 4.11% |
Basic Info
| Investment Strategy | |
| The Fund seeks to provide income. Under normal market and economic conditions, the Fund will invest at least 80% of its net assets (plus the amount of any borrowings for investment purposes) in Senior Loans, and in derivatives and other instruments that have economic characteristics similar to such securities. |
| General | |
| Security Type | Mutual Fund |
| Equity Style | -- |
| Broad Asset Class | Taxable Bond |
| Broad Category | Fixed Income |
| Global Peer Group | Loan Participation Funds |
| Peer Group | Loan Participation Funds |
| Global Macro | Loan Participation Funds |
| US Macro | General Domestic Taxable Fixed Income Funds |
| YCharts Categorization | -- |
| YCharts Benchmark | -- |
| Prospectus Objective | Loan Participation Funds |
| Fund Owner Firm Name | Invesco |
| Broad Asset Class Benchmark Index | |
| ^BBUSATR | 100.0% |
Net Fund Flows Versus Peer Group
1 Month
% Rank:
81
-120.38M
Peer Group Low
1.130B
Peer Group High
1 Year
% Rank:
79
-386.66M
-1.857B
Peer Group Low
6.524B
Peer Group High
3 Months
% Rank:
73
-902.22M
Peer Group Low
2.516B
Peer Group High
3 Years
% Rank:
85
-2.611B
Peer Group Low
21.94B
Peer Group High
6 Months
% Rank:
77
-1.596B
Peer Group Low
4.432B
Peer Group High
5 Years
% Rank:
89
-4.547B
Peer Group Low
24.56B
Peer Group High
YTD
% Rank:
78
-1.334B
Peer Group Low
3.795B
Peer Group High
10 Years
% Rank:
100
-10.87B
Peer Group Low
25.40B
Peer Group High
Date Unavailable
Risk
Performance Versus Peer Group
Annual Total Returns Versus Peers
As of June 10, 2026.
Asset Allocation
As of April 30, 2026.
| Type | % Net |
|---|---|
| Cash | 3.32% |
| Stock | 5.51% |
| Bond | 93.49% |
| Convertible | 0.00% |
| Preferred | 0.55% |
| Other | -2.88% |
Top 10 Holdings
| Name | % Weight | Price | % Change |
|---|---|---|---|
| Invesco Government & Agency Portfolio Inst | 2.19% | 1.00 | 0.00% |
|
My Alarm Center LLC FRN
|
1.80% | -- | -- |
| Invesco Treasury Portfolio Institutional | 1.46% | 1.00 | 0.00% |
|
Summer BC Holdco B SARL FRN 04-Jun-2026
|
1.12% | -- | -- |
|
Spin Holdco Inc FRN
|
1.06% | -- | -- |
|
Monitronics International Inc
|
0.96% | -- | -- |
|
USD Cash
|
0.90% | -- | -- |
|
Monitronics International Inc FRN 30-Jun-2028
|
0.88% | -- | -- |
|
Florida Food Products LLC FRN 15-Oct-2030
|
0.86% | -- | -- |
|
VUE Entertainment International Ltd PIK FRN 31-Dec-2029
|
0.86% | -- | -- |
Fees & Availability
| Fees | |
| Actual 12B-1 Fee | 0.25% |
| Actual Management Fee | 0.61% |
| Administration Fee | -- |
| Maximum Front Load | 3.25% |
| Maximum Deferred Load | -- |
| Maximum Redemption Fee | -- |
| General Availability | |
| Available for Insurance Product | No |
| Available for RRSP | No |
| Purchase Details | |
| Open to New Investors |
|
| Minimum Initial Investment | 1000.00 None |
| Minimum Subsequent Investment | 50.00 None |
Basic Info
| Investment Strategy | |
| The Fund seeks to provide income. Under normal market and economic conditions, the Fund will invest at least 80% of its net assets (plus the amount of any borrowings for investment purposes) in Senior Loans, and in derivatives and other instruments that have economic characteristics similar to such securities. |
| General | |
| Security Type | Mutual Fund |
| Equity Style | -- |
| Broad Asset Class | Taxable Bond |
| Broad Category | Fixed Income |
| Global Peer Group | Loan Participation Funds |
| Peer Group | Loan Participation Funds |
| Global Macro | Loan Participation Funds |
| US Macro | General Domestic Taxable Fixed Income Funds |
| YCharts Categorization | -- |
| YCharts Benchmark | -- |
| Prospectus Objective | Loan Participation Funds |
| Fund Owner Firm Name | Invesco |
| Broad Asset Class Benchmark Index | |
| ^BBUSATR | 100.0% |
Fundamentals
| General | |
| Distribution Yield | -- |
| Dividend Yield TTM (6-8-26) | 7.72% |
| 30-Day SEC Yield (5-31-26) | 5.92% |
| 7-Day SEC Yield | -- |
| Number of Holdings | 478 |
| Stock | |
| Weighted Average PE Ratio | -- |
| Weighted Average Price to Sales Ratio | -- |
| Weighted Average Price to Book Ratio | -- |
| Weighted Median ROE | -- |
| Weighted Median ROA | -- |
| ROI (TTM) | -- |
| Return on Investment (TTM) | -- |
| Earning Yield | -- |
| LT Debt / Shareholders Equity | -- |
| Number of Equity Holdings | 29 |
| Bond | |
| Yield to Maturity (4-30-26) | 7.45% |
| Effective Duration | 0.13 |
| Average Coupon | 7.63% |
| Calculated Average Quality | 5.775 |
| Effective Maturity | 4.345 |
| Nominal Maturity | 4.358 |
| Number of Bond Holdings | 408 |
As of April 30, 2026
Growth Metrics
| EPS Growth (1Y) | -- |
| EPS Growth (3Y) | -- |
| EPS Growth (5Y) | -- |
| Sales Growth (1Y) | -- |
| Sales Growth (3Y) | -- |
| Sales Growth (5Y) | -- |
| Sales per Share Growth (1Y) | -- |
| Sales per Share Growth (3Y) | -- |
| Operating Cash Flow - Growth Rate (3Y) | -- |
As of April 30, 2026
Fund Details
| Key Dates | |
| Inception Date | 9/8/1999 |
| Last Annual Report Date | 8/31/2025 |
| Last Prospectus Date | 12/19/2025 |
| Share Classes | |
| OOSCX | C |
| OOSIX | Retirement |
| OOSNX | Retirement |
| OOSYX | Inst |
| SFRRX | Retirement |
| Attributes | |
| Index Fund | -- |
| Inverse Fund | No |
| Leveraged Fund | -- |
| Fund of Funds | No |
| Currency Hedged Fund | -- |
| Socially Responsible Fund | No |
Top Portfolio Holders
| Name | % Weight |
|---|---|
| Portfolio A | 5.00% |
| Portfolio B | 3.50% |
| Portfolio C | 2.25% |
Excel Add-In Codes
| Name: =YCI("M:OOSAX", "name") |
| Broad Asset Class: =YCI("M:OOSAX", "broad_asset_class") |
| Broad Category: =YCI("M:OOSAX", "broad_category_group") |
| Prospectus Objective: =YCI("M:OOSAX", "prospectus_objective") |
| To find the codes for any of our securities and financial metrics, see our Complete Excel Reference. |