

Oakmark International Small Cap Fund Advisor (OAYEX)
21.41
+0.06
(+0.28%)
USD |
Jun 09 2026
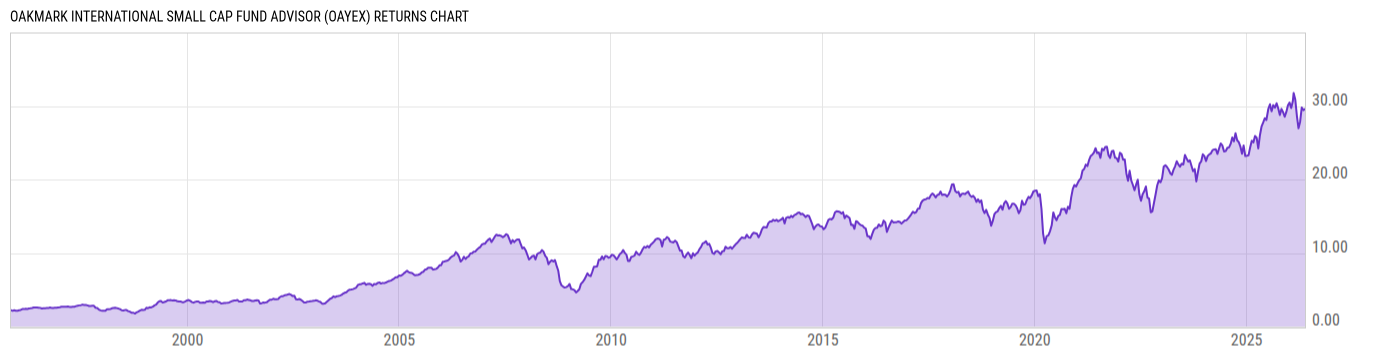
Returns Chart
Key Stats
| Net Expense Ratio | Total Assets Under Management | Weighted Average Dividend Yield | Turnover Ratio (Generic) |
|---|---|---|---|
| 1.17% | 1.218B | 3.08% | 37.00% |
| 1 Year Fund Level Flows | 1 Year Total Returns (Daily) | Annualized Total Returns Since Inception (Daily) | Max Drawdown (Since Inception) |
| -157.94M | 3.12% |
Basic Info
| Investment Strategy | |
| The Fund seeks long-term capital appreciation. Under normal circumstances, the Fund invests at least 80% of its net assets in the stocks of small cap companies. A small cap company is one whose market cap is no greater than the largest market capitalization of any company, included in the S&P EPAC Small Cap Index. |
| General | |
| Security Type | Mutual Fund |
| Equity Style | Mid Cap Value |
| Broad Asset Class | International Equity |
| Broad Category | Equity |
| Global Peer Group | Equity Global ex US Sm&Mid Cap |
| Peer Group | International Small/Mid-Cap Core |
| Global Macro | Equity Global |
| US Macro | Developed International Markets Funds |
| YCharts Categorization | -- |
| YCharts Benchmark | -- |
| Prospectus Objective | International Small-Cap Funds |
| Fund Owner Firm Name | Oakmark Funds |
| Broad Asset Class Benchmark Index | |
| ^MSACXUSNTR | 100.0% |
Net Fund Flows Versus Peer Group
1 Month
% Rank:
60
-180.96M
Peer Group Low
722.92M
Peer Group High
1 Year
% Rank:
77
-157.94M
-322.96M
Peer Group Low
1.961B
Peer Group High
3 Months
% Rank:
72
-378.58M
Peer Group Low
722.92M
Peer Group High
3 Years
% Rank:
90
-1.207B
Peer Group Low
3.598B
Peer Group High
6 Months
% Rank:
77
-406.46M
Peer Group Low
905.89M
Peer Group High
5 Years
% Rank:
94
-2.300B
Peer Group Low
4.276B
Peer Group High
YTD
% Rank:
75
-376.93M
Peer Group Low
722.92M
Peer Group High
10 Years
% Rank:
97
-4.481B
Peer Group Low
6.327B
Peer Group High
Date Unavailable
Risk
Performance Versus Peer Group
Annual Total Returns Versus Peers
As of June 10, 2026.
Asset Allocation
As of March 31, 2026.
| Type | % Net |
|---|---|
| Cash | 2.57% |
| Stock | 94.37% |
| Bond | 0.00% |
| Convertible | 0.00% |
| Preferred | 0.86% |
| Other | 2.20% |
Top 10 Holdings
| Name | % Weight | Price | % Change |
|---|---|---|---|
| Atea ASA | 3.22% | 17.55 | 10.02% |
| Julius Bär Gruppe AG | 3.03% | 83.18 | 0.00% |
| Azelis Group NV | 3.03% | 11.62 | 0.00% |
| Azimut Holding SpA | 2.76% | 41.75 | 0.00% |
| Amplifon SpA | 2.68% | 12.01 | 0.00% |
| Fielmann Group AG | 2.65% | 50.75 | 0.00% |
|
Fixed Income Clearing Corp Repo
|
2.57% | -- | -- |
| Valmet Corp. | 2.56% | 26.86 | 0.00% |
| Davide Campari-Milano NV | 2.56% | 6.50 | 1.72% |
| Dürr AG | 2.54% | 24.24 | 0.00% |
Fees & Availability
| Fees | |
| Actual 12B-1 Fee | -- |
| Actual Management Fee | 0.99% |
| Administration Fee | -- |
| Maximum Front Load | -- |
| Maximum Deferred Load | -- |
| Maximum Redemption Fee | 0.00% |
| General Availability | |
| Available for Insurance Product | No |
| Available for RRSP | No |
| Purchase Details | |
| Open to New Investors |
|
| Minimum Initial Investment | 100000.0 None |
| Minimum Subsequent Investment | 0.00 None |
Basic Info
| Investment Strategy | |
| The Fund seeks long-term capital appreciation. Under normal circumstances, the Fund invests at least 80% of its net assets in the stocks of small cap companies. A small cap company is one whose market cap is no greater than the largest market capitalization of any company, included in the S&P EPAC Small Cap Index. |
| General | |
| Security Type | Mutual Fund |
| Equity Style | Mid Cap Value |
| Broad Asset Class | International Equity |
| Broad Category | Equity |
| Global Peer Group | Equity Global ex US Sm&Mid Cap |
| Peer Group | International Small/Mid-Cap Core |
| Global Macro | Equity Global |
| US Macro | Developed International Markets Funds |
| YCharts Categorization | -- |
| YCharts Benchmark | -- |
| Prospectus Objective | International Small-Cap Funds |
| Fund Owner Firm Name | Oakmark Funds |
| Broad Asset Class Benchmark Index | |
| ^MSACXUSNTR | 100.0% |
Fundamentals
| General | |
| Distribution Yield | -- |
| Dividend Yield TTM (6-8-26) | 1.98% |
| 30-Day SEC Yield | -- |
| 7-Day SEC Yield | -- |
| Number of Holdings | 72 |
| Stock | |
| Weighted Average PE Ratio | 19.56 |
| Weighted Average Price to Sales Ratio | 1.377 |
| Weighted Average Price to Book Ratio | 2.477 |
| Weighted Median ROE | 15.55% |
| Weighted Median ROA | 4.35% |
| ROI (TTM) | 8.59% |
| Return on Investment (TTM) | 8.59% |
| Earning Yield | 0.0680 |
| LT Debt / Shareholders Equity | 0.7395 |
| Number of Equity Holdings | 59 |
As of March 31, 2026
Growth Metrics
| EPS Growth (1Y) | 0.39% |
| EPS Growth (3Y) | 2.77% |
| EPS Growth (5Y) | 8.04% |
| Sales Growth (1Y) | 2.92% |
| Sales Growth (3Y) | 5.01% |
| Sales Growth (5Y) | 7.64% |
| Sales per Share Growth (1Y) | 3.42% |
| Sales per Share Growth (3Y) | 5.09% |
| Operating Cash Flow - Growth Rate (3Y) | 19.80% |
As of March 31, 2026
Fund Details
Top Portfolio Holders
| Name | % Weight |
|---|---|
| Portfolio A | 5.00% |
| Portfolio B | 3.50% |
| Portfolio C | 2.25% |
Excel Add-In Codes
| Name: =YCI("M:OAYEX", "name") |
| Broad Asset Class: =YCI("M:OAYEX", "broad_asset_class") |
| Broad Category: =YCI("M:OAYEX", "broad_category_group") |
| Prospectus Objective: =YCI("M:OAYEX", "prospectus_objective") |
| To find the codes for any of our securities and financial metrics, see our Complete Excel Reference. |